Bitcoin
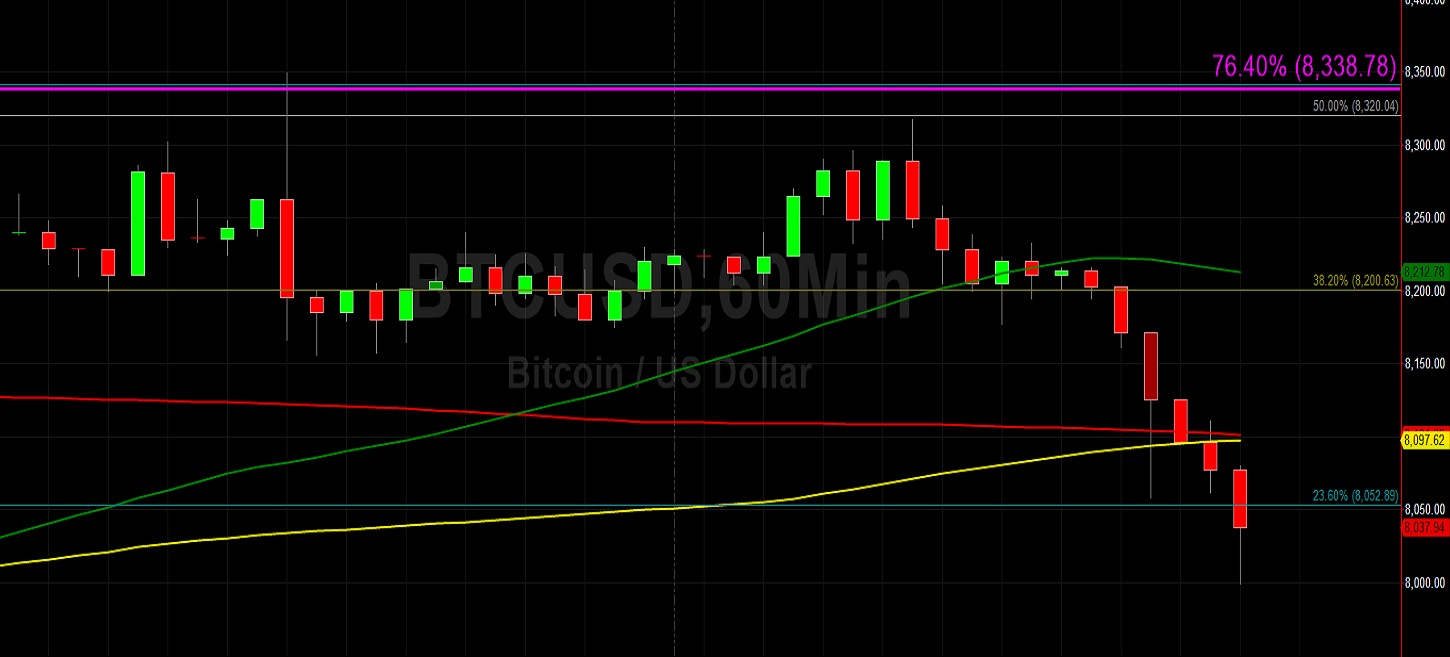
Bitcoin (BTC/USD) depreciated to the 7998.90 level early in today’s Asian session as the pair failed to sustain a move higher to the 8317.14 area during yesterday’s North American session. The pair has recently been orbiting the 8200.63 area, representing the 38.2% retracement of the 8826.00 – 7814.08 range, and derived support around that level during yesterday’s European and North American sessions. Buying pressure also emerged around the 50-bar MA (4-hourly) during yesterday’s North American session, then indicating arou nd the 8201 level, but Stops were elected below it during this most recent downturn.
Chartists also note that the 100-bar MA (4-hourly) was indicating around the 8195 area when the pair found buying pressure around the 8200 area, an indication that traders may have been trying to keep the pair above that level. Some selling pressure arose yesterday around the 8317 area, just below the 50% retracement of the aforementioned 8826.00 – 7814.08 range. Below current market activity, traders anticipate buying pressure around the 8015 and 7966 levels. Above current market activity, traders anticipate selling pressure around the 8432, 8502, and 8692 levels.
Price activity is nearest the 50-bar MA (4-hourly) at 8,099.67 and the 100-bar MA (Hourly) at 8,097.60.
Technical Support is expected around 7,712.45/ 7,508.77/ 7,223.25 with Stops expected below.
Technical Resistance is expected around 8560.50 /9,071.00/ 9,651.00 with Stops expected above.
On 4-Hourly chart, SlowK is Bearishly below SlowD while MACD is Bearishly below MACDAverage.
On 60-minute chart, SlowK is Bearishly below SlowD while MACD is Bearishly below MACDAverage.
Ethereum
Ethereum (ETH/USD) depreciated early in today’s Asian session as the pair traded as low as the 170.47 area after steady selling pressure yesterday resulted in Stops being elected below the 171.21 level. The pair drifted lower during yesterday’s European and North American sessions, unable to sustain some buying activity above the 50-bar MA (hourly), and then traded below the 100-bar MA (hourly). On a bullish note, the 50-bar MA (hourly) crossed above the 100-bar MA (hourly) during yesterday’s Asian session, and this could lead to additional upside price gains.
Traders are monitoring price activity around the 172.88 area, a level that traders tested several times during yesterday’s European and North American sessions, representing the 38.2% retracement of the 322.16 – 80.60 range. Notably, the 172.51 area represents the 61.8% retracement of the 169.11 – 178.00 range, and price activity has recently been capped around the 174.60 area, representing the 38.2% retracement of the same range. Below current market activity, buying pressure is expected around the 171 and 169 areas. Above current market activity, selling pressure is expected around the 175 and 179 levels.
Price activity is nearest the 50-bar MA (4-hourly) at 175.63 and the 100-bar MA (Hourly) at 173.39.
Technical Support is expected around 167.80/ 165.25/ 162.93 with Stops expected below.
Technical Resistance is expected around 175.02/ 180.45/ 183.33 with Stops expected above.
On 4-Hourly chart, SlowK is Bearishly below SlowD while MACD is Bearishly below MACDAverage.
On 60-minute chart, SlowK is Bearishly below SlowD while MACD is Bearishly below MACDAverage.