Sally Ho's Technical Analysis 18 October 2019
Bitcoin
Bitcoin (BTC/USD) was a little stronger early in today’s Asian session as the pair traded as high as the 8081.69 area after trading as low as the 7937.01 level during yesterday’s European session. During the pair’s ascent yesterday, BTC Bulls pushed the pair as high as the 8124.42 area, just below the 8130.75 area that represents the 61.8% retracement of the 7701.00 – 8826.00 range. Before testing that level, some buying demand emerged around the 8015.13 area, representing the 23.6% retracement of the 8995.00 – 7712.45 range.
After testing this level, some buying interest emerged around and below the 8055.91 area. The pair has climbed back from intraweek lows around the 7908.86 area and chartists are eager to observe price activity around the 8130.75 area, above which Stops are likely in place. BTC/USD continues to trade below the 50-bar MA (4-hourly), 100-bar MA (4-hourly), and 200-bar MA (4-hourly) and is now trading between the 50-bar MA (hourly) and 100-bar MA (hourly). Above current market activity, the 8203 area is an area where many traders anticipate some selling pressure.
Price activity is nearest the 100-bar MA (4-hourly) at 8,232.75 and the 50-bar MA (Hourly) at 8,050.68.
Technical Support is expected around 7,712.45/ 7,508.77/ 7,223.25 with Stops expected below.
Technical Resistance is expected around 8560.50 /9,071.00/ 9,651.00 with Stops expected above.
On 4-Hourly chart, SlowK is Bullishly above SlowD while MACD is Bullishly above MACDAverage.
On 60-minute chart, SlowK is Bullishly above SlowD while MACD is Bullishly above MACDAverage.
Ethereum
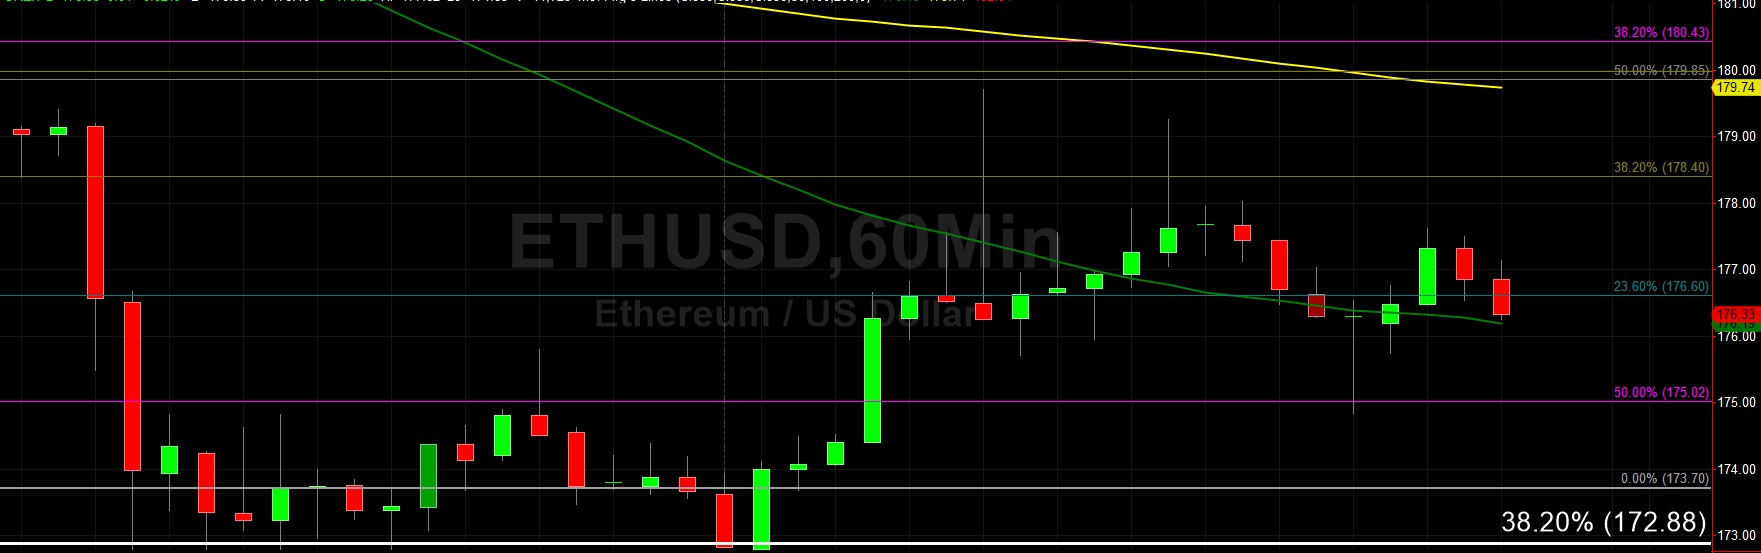
Ethereum (ETH/USD) was slightly weaker early in today’s Asian session as the pair depreciated to the 176.53 area after trading as high as the 179.71 area during yesterday’s European session. Traders were unable to eclipse this area yesterday, one that is right around the 38.2% retracement of the move from 224.71 to 152.11, and also just below the 200-bar MA (4-hourly). During the pair’s depreciation late in the North American session, Bids emerged around the 174.83 area, just below the 50% retracement of the move from 152.11 to 197.97.
ETH/USD continues to trade below the 50-bar MA (4-hourly), 100-bar MA (4-hourly), and 200-bar MA (4-hourly) and is now trading between its 50-bar MA (hourly) and 100-bar MA (hourly). The pair continues to orbit its 50-bar MA (hourly) in the short-term, an indication that traders lack a significant market bias now. Below current market activity, technicians are looking to see if buying demand again emerges around the 172.88 area, representing the 38.2% retracement of the 322.16 – 80.60 range. Above current market activity, traders anticipate some selling pressure between the 180.43 and 181.30 levels.
Price activity is nearest the 100-bar MA (4-hourly) at 179.92 and the 50-bar MA (Hourly) at 176.19.
Technical Support is expected around 169.24/ 165.25/ 162.93 with Stops expected below.
Technical Resistance is expected around 179.84/ 183.33/ 187.15 with Stops expected above.
On 4-Hourly chart, SlowK is Bullishly above SlowD while MACD is Bullishly above MACDAverage.
On 60-minute chart, SlowK is Bullishly above SlowD while MACD is Bullishly above MACDAverage.
