Sally Ho's Technical Analysis 10 October 2019
Bitcoin
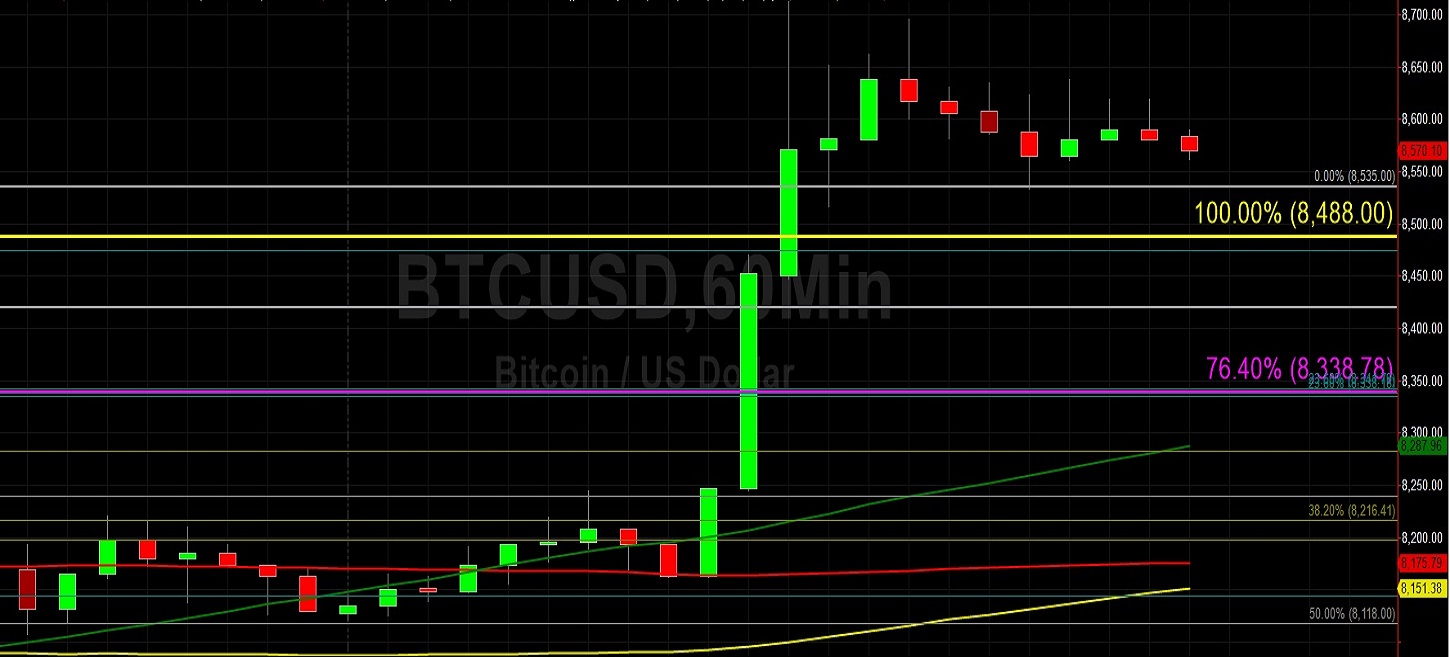
Bitcoin (BTC/USD) was mostly flat early in today’s Asian session after the pair’s sharp climb higher during yesterday’s North American session tested the 8712.45 area, representing the 76.4% retracement of the move from 8995.00 to 7712.45. Minor Stops were triggered above that level and the corresponding pullback saw Bids emerge around the 8516 area, right around the 50% retracement of the move from 3136.25 to 13868.44. The move pushed BTC/USD above its 50-bar MA (hourly), 100-bar MA (hourly), and 200-bar MA (hourly).
Bids emerged right around the 50-bar MA (4-hourly) during the pair’s rapid ascent yesterday and some additional Stops were triggered above the 8341.11 level en route to the pair’s multi-session high, right around the 100-bar MA (4-hourly). Yesterday’s high was the pair’s strongest print since 24 September following the crash of BTC/USD below the psychologically-important 10000 figure. The pair’s trading activity around and above the 8535 area suggest BTC/USD could be primed for additional upside gains. Some additional upside price objectives include the 8945.12 and 9009.65 areas.
Price activity is nearest the 100-bar MA (4-hourly) at 8,301.03 and the 50-bar MA (Hourly) at 8,287.88.
Technical Support is expected around 7,712.45/ 7,508.77/ 7,223.25 with Stops expected below.
Technical Resistance is expected around 9,071.00/ 9,651.00/ 9938.16 with Stops expected above.
On 4-Hourly chart, SlowK is Bearishly below SlowD while MACD is Bullishly above MACDAverage.
On 60-minute chart, SlowK is Bearishly below SlowD while MACD is Bullishly above MACDAverage.
Ethereum
Ethereum (ETH/USD) was mostly sideways early in today’s Asian session as the pair traded as high as the 194.55 area following a high print of 196.09 after the pair’s rapid ascent yesterday. During yesterday’s North American session, the pair was dramatically lifted to the 194.74 level after Stops were elected above the 200-bar MA (4-hourly), then indicating around the 184.34 area. Additional Stops were triggered above the 191.40 area, representing the 50% retracement of the move from 302.20 to 80.60.
During ETH/USD’s dramatic appreciation, there was a brief pause when the pair tested the 188.38 area, representing the 61.8% retracement of the 255.00 – 80.60 range. Bids emerged just below the 190.80 area several times during the pair’s pullbacks, a level that represents the 23.6% retracement of the move from 547.54 to 80.60. Above current market activity, the 197.56 area represents the 76.4% retracement of the move from 147.00 to 364.49. If traders are able to eclipse the psychologically-important 200.00 figure, another important level is the 202.38 area, representing the 61.8% retracement of the move from 148.91 to 288.87.
Price activity is nearest the 200-bar MA (4-hourly) at 184.63 and the 50-bar MA (Hourly) at 183.93.
Technical Support is expected around 176.40/ 170.95/ 165.01 with Stops expected below.
Technical Resistance is expected around 197.56/ 202.38/ 206.29 with Stops expected above.
On 4-Hourly chart, SlowK is Bearishly below SlowD while MACD is Bullishly above MACDAverage.
On 60-minute chart, SlowK is Bearishly below SlowD while MACD is Bullishly above MACDAverage.
