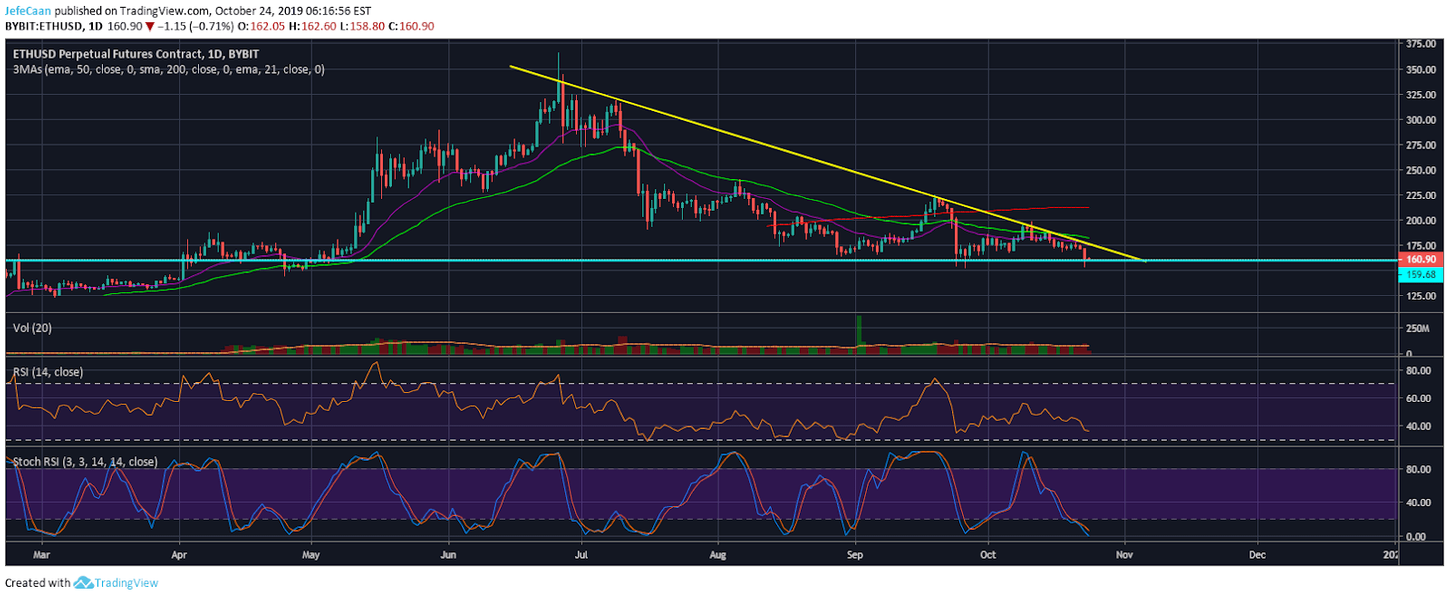
There is a descending triangle on Ethereum (ETH) that would give most retail bears good reason not to close their shorts. Until recently, this descending triangle was more of a symmetrical triangle but after the recent crash, it has become a descending triangle. This would lead more retail bears joining in at this point thinking the price is ready to crash below $160 from here down to finally begin the long anticipated downtrend. The bears have been waiting for this downtrend for a long time but in times like these a little more patience would prove to be a lot more fruitful and hastiness may prove to be devastating. Everyone can spot this descending triangle on the chart and most traders know descending triangles break to the downside most of the time.

However, what most traders don’t realize is that descending triangles might eventually break to the downside but we have seen countless cases of descending triangles being invalidated in the past. The reason why that has happened is because the setups were too obvious like the one we see now on the daily chart for ETH/USD. If the price were to decline here, it would be too simple and easy. This is seldom how it happens in this market. The most probable scenario is that the price might trade sideways for a while to let shorts stack up. Then when everyone is short, we might see a big move to the upside to liquidate most of the greedy retail shorts. After that, we will see the downtrend begin.
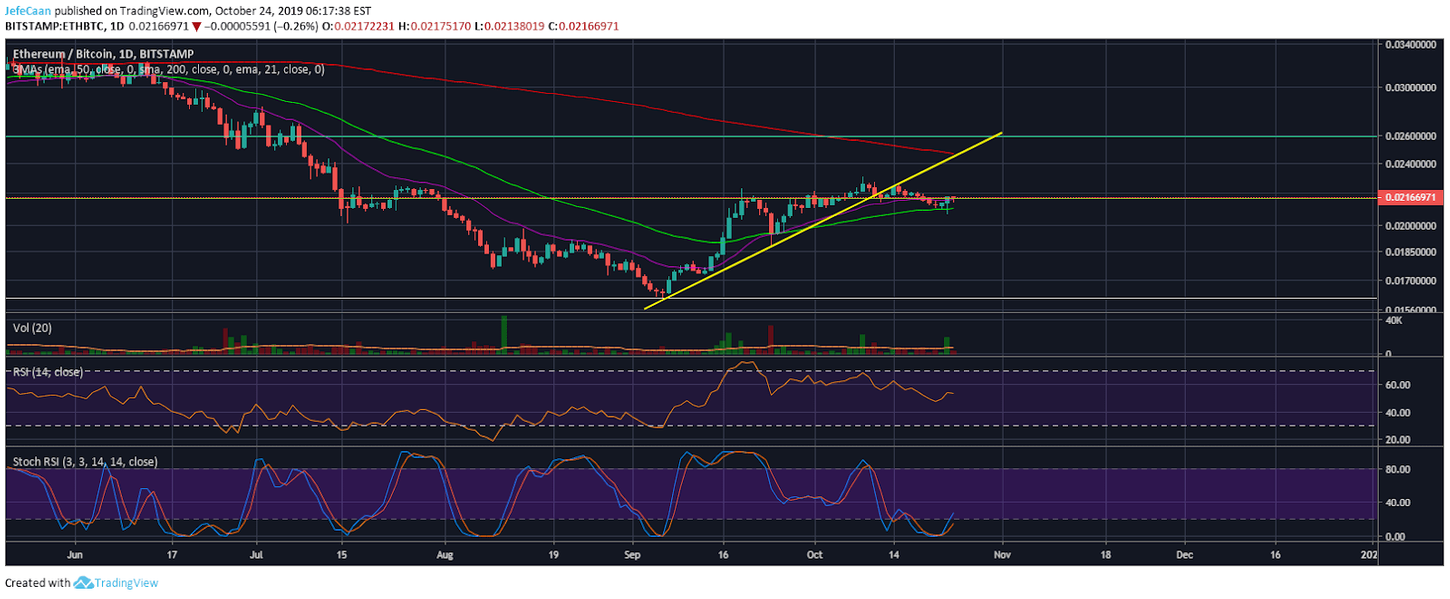
Most of you would have noticed that Ethereum (ETH) did not fall like most altcoins during the recent crash. In fact, it closed the day in the green against Bitcoin (BTC) above the 21 day EMA even though it had broken below the 50 day EMA. I think some of these clues are indicative of what is going to happen next in the market. If we were supposed to have another crash down to lower levels in Ethereum (ETH) then ETH/BTC might not have closed the day in the green and above the 21 day EMA.
As traders, it is important that we keep things simple. If we look at this chart, we can see that the Stochastic RSI is near oversold territory and the RSI is in an uptrend since mid-August. Meanwhile, the pair is resting above the 38.2% fib retracement level and is ready to rally higher. In my opinion, the cryptocurrency market is primed for another uptrend short term. Even though I expect ETH/USD to decline below $80 to eventually find its true bottom, I think it has plenty of room to rally even past $200 near term once the dust settles.