Sally Ho's Technical Analysis 17 September 2019
Bitcoin
Bitcoin (BTC/USD) weakened early in today’s Asian session but only after the pair jumped sharply higher late in yesterday’s Asian session as a result of aggressive buying that saw the pair lifted to the 10355.03 area after Bids emerged around the 10068.42 level. Minor Stops were reached above the 10347.33 area, representing the 76.4% retracement of the 10433.49 – 10068.42 area. Notably, the 50-bar MA (hourly), 100-bar MA (hourly), and 200-bar MA (hourly) have nearly converged, indicating the markets are uncertain about short-term sentiment following a drastic depreciation below the 10095.00 area during yesterday’s European session.
Likewise, the 50-bar MA (4-hourly), 100-bar MA (4-hourly), and 200-bar MA (4-hourly) have largely converged, a further indication of a lack of a market bias. Chartists observe that the 10395.66 area is a level that BTC/USD Bulls need to absorb and build upon in order to make additional upside progress. Likewise, the 9765.93 area is a level that BTC/USD Bears need to get the pair below in order to make downside progress. Above current market activity, the 10820.32 and 10939.34 areas are upside price objectives. Below current market activity, the 9532.39 area is an important downside price target.
Price activity is nearest the 50-bar MA (4-hourly) at 10,261.25 and the 200-bar MA (Hourly) at 10,273.31.
Technical Support is expected around 9,765.93/ 9,532.39/ 9,265.49 with Stops expected below.
Technical Resistance is expected around 10,833.14/ 11,136.82/ 11,759.72 with Stops expected above.
On 4-Hourly chart, SlowK is Bullishly above SlowD while MACD is Bearishly below MACDAverage.
On 60-minute chart, SlowK is Bearishly below SlowD while MACD is Bullishly above MACDAverage.
Ethereum
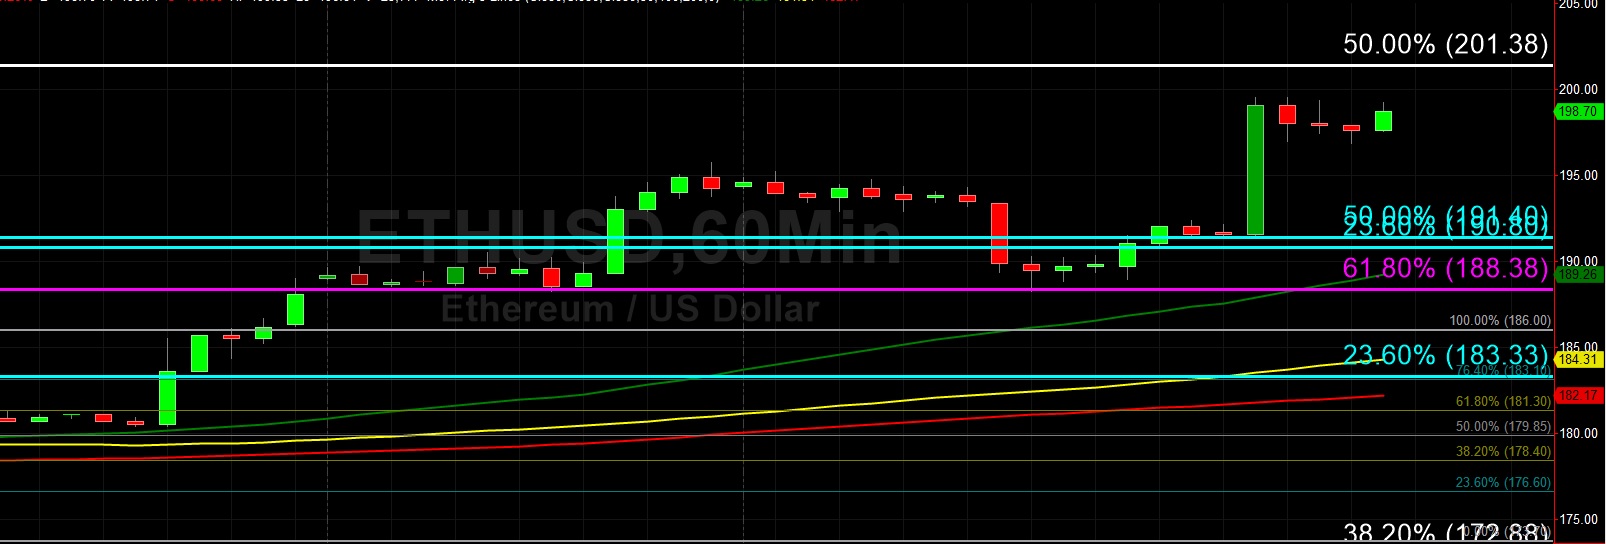
Ethereum (ETH/USD) extended recent gains early in today’s Asian session as the pair traded as high as the 199.55 area before yielding a small amount of gains. Late in yesterday’s European session, some Bids emerged around the 189.05 area during a pullback, representing the 61.8% retracement of the 80.60 – 364.49 range. Also, the 191.40 area represents the 50% retracement of the move from 302.20 to 80.60. The pair is comfortably trading above the 50-bar MA (4-hourly), 100-bar MA (4-hourly), and 200-bar MA (4-hourly).
Also, ETH/USD is trading above the 50-bar MA (hourly), 100-bar MA (hourly), and 200-bar MA (hourly). If the pair is able to move above the psychologically-important 200.00 figure, the next upside targets include the 202.38 and 204.12 levels. Additionally, the 206.18 area represents the 76.4% retracement of the 157.29 – 364.49 range and the 209.75 area represents the 23.6% retracement of the 627.83 – 80.60 range followed by the 217.55 area representing the 61.8% retracement of the 302.20 – 80.60 range.
Price activity is nearest the 200-bar MA (4-hourly) at 182.81 and the 50-bar MA (Hourly) at 189.27.
Technical Support is expected around 191.40/ 188.38/ 186.00 with Stops expected below.
Technical Resistance is expected around 206.18/ 209.75/ 217.55 with Stops expected above.
On 4-Hourly chart, SlowK is Bullishly above SlowD while MACD is Bullishly above MACDAverage.
On 60-minute chart, SlowK is Bullishly above SlowD while MACD is Bullishly above MACDAverage.
