Bitcoin
Bitcoin (BTC/USD) gave back a small amount of gains early in today’s Asian session following the pair’s quick ascent late in yesterday’s North American session that saw traders lift the pair from the 10157 level to the 10392 level, right around the 50% retracement of the move from 10939.34 to 9851.97. Traders tested the 100-bar MA (4-hourly) around the 10150 area before driving BTC/USD higher late in yesterday’s North American session. The pair continues to trade above and below both the 50-day MA (4-hourly) and 200-day MA (4-hourly).
If BTC/USD is able to climb above the 10392 area, traders anticipate Offers around the 10523 and 10541 areas, with the former representing the 61.8% retracement of the 10939.34 – 9851.97 range. Another important level above current market activity that traders are watching is the 10820.32 area, representing the 61.8% retracement of the 8929.91 – 13878.63 range. Stops are likely in place above the 10939 area. Below current market activity, traders continue to monitor the 9765.93 area.
Price activity is nearest the 50-bar MA (4-hourly) at 10,333.78 and the 200-bar MA (Hourly) at 10,338.90.
Technical Support is expected around 9,765.93/ 9,532.39/ 9,265.49 with Stops expected below.
Technical Resistance is expected around 10,833.14/ 11,136.82/ 11,759.72 with Stops expected above.
On 4-Hourly chart, SlowK is Bullishly above SlowD while MACD is Bullishly above MACDAverage.
On 60-minute chart, SlowK is Bearishly below SlowD while MACD is Bullishly above MACDAverage.
Ethereum
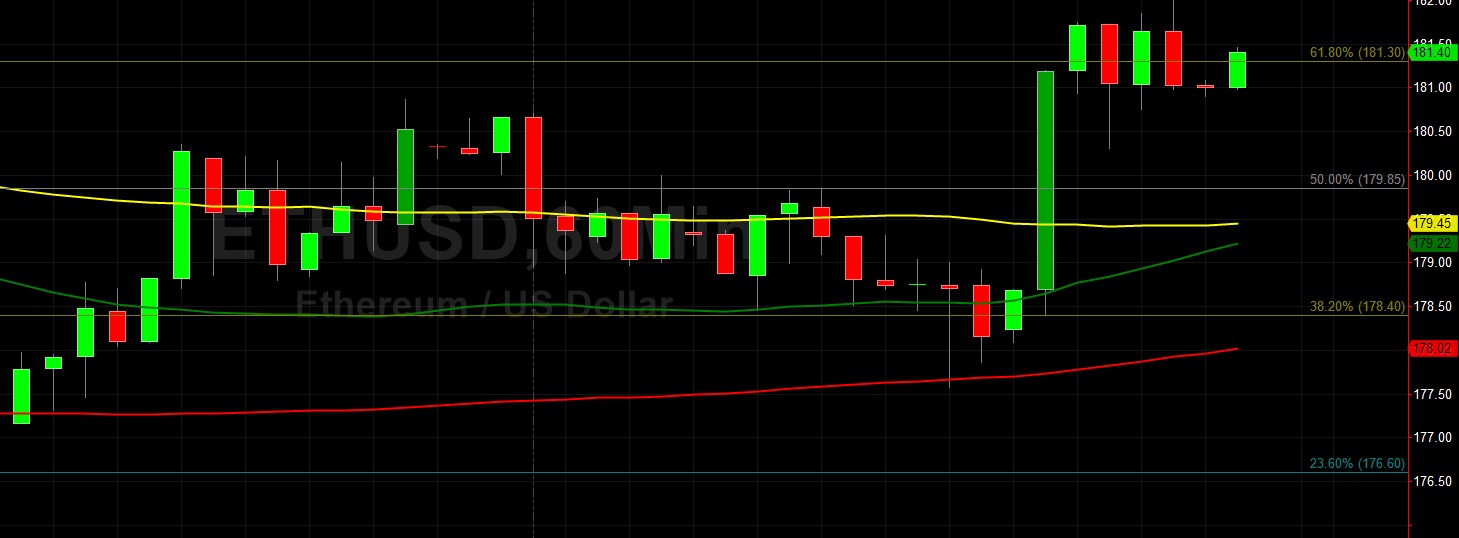
Ethereum (ETH/USD) slid slightly lower early in today’s Asian session as the pair traded as low as the 180.90 area after trading as high as the 181.85 area late in yesterday’s North American session. Traders lifted the pair from yesterday’s daily low of 177.57 during the North American session, just below the 50-bar MA (4-hourly). Notably, yesterday’s daily high and today’s intraday high are around the 76.4% retracement of the 148.91 – 288.87 range.
Stops were elected above the 181.04 area during yesterday’s ascent, representing the 23.6% retracement of the 164.99 – 186.00 range. Above current market activity, traders continue to anticipate selling pressure around the 183.33 area, representing the 23.6% retracement of the 515.88 – 80.60 range. Above that area, selling pressure is expected around the 187 – 190 area and the 191.40 level represents the 50% retracement of the 302.20 – 80.60 range.
Price activity is nearest the 200-bar MA (4-hourly) at 184.23 and the 100-bar MA (Hourly) at 179.45.
Technical Support is expected around 172.88/ 167.80/ 165.25 with Stops expected below.
Technical Resistance is expected around 188.38/ 191.40/ 201.38 with Stops expected above.
On 4-Hourly chart, SlowK is Bullishly above SlowD while MACD is Bullishly above MACDAverage.
On 60-minute chart, SlowK is Bearishly below SlowD while MACD is Bullishly above MACDAverage.