Sally Ho's Technical Analysis 12 September 2019
Bitcoin
Bitcoin (BTC/USD) gained marginal ground early in today’s Asian session as the pair climbed to the 10199.77 area and traded as low as the 9926.49 area during yesterday’s North American session, just below the 61.8% retracement of the 7508.77 – 13868.44 range. BTC/USD was generally weaker yesterday and traded below the 100-bar MA (4-hourly) during most of yesterday’s Asian and European sessions. Notably, the intraday high through the early part of today’s Asian session was right around the 50% retracement of the recent 10451.75 – 9851.97 range.
BTC/USD climbed back above the 50-bar MA (hourly) and must now contend with the 100-bar MA (hourly) and 200-bar MA (hourly), in addition to the 100-bar MA (4-hourly) and 200-bar MA (4-hourly). The pair lacks a definite market bias and has mixed sentiment as it continues to orbit the psychologically-important 10000 figure. Below current market levels, traders are observing technical Support around areas including 9765, 9651, and 9532. Above current market levels, traders are observing technical Resistance around areas including 10395, 10523, and 10682. The 10647.72 is an upside price objective that represents the 50% retracement of the 7427.00 – 13868.44 range.
Price activity is nearest the 100-bar MA (4-hourly) at 10,141.37 and the 50-bar MA (Hourly) at 10,140.03.
Technical Support is expected around 9,765.93/ 9,532.39/ 9,265.49 with Stops expected below.
Technical Resistance is expected around 10,833.14/ 11,136.82/ 11,759.72 with Stops expected above.
On 4-Hourly chart, SlowK is Bullishly above SlowD while MACD is Bullishly above MACDAverage.
On 60-minute chart, SlowK is Bearishly below SlowD while MACD is Bullishly above MACDAverage.
Ethereum
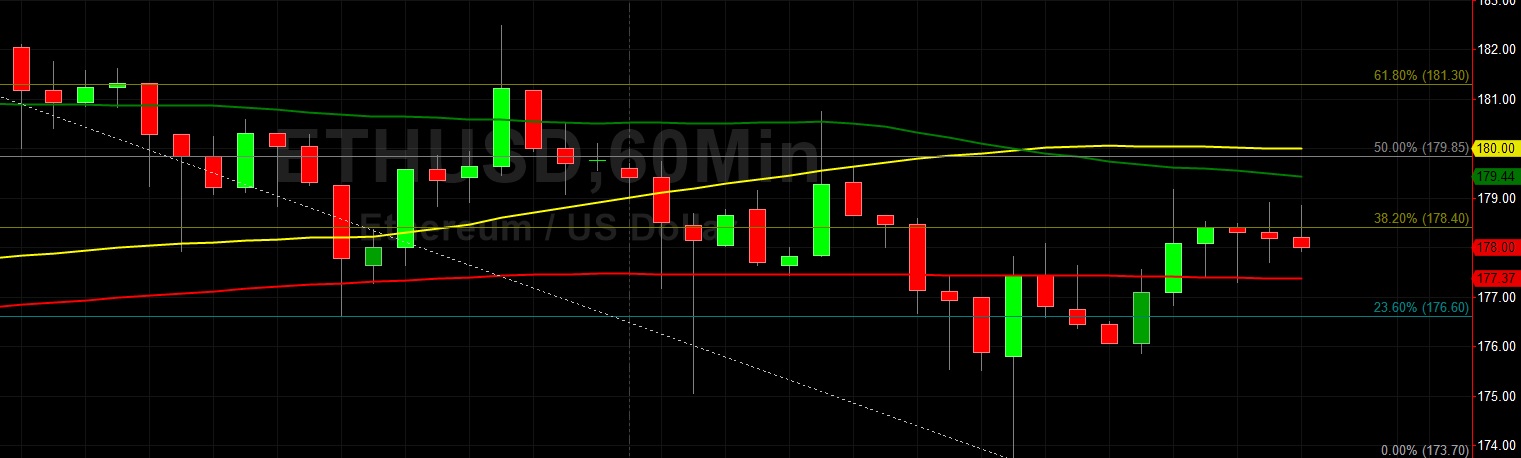
Ethereum (ETH/USD) appreciated early in today’s Asian session as the pair climbed to the 178.92 area and encountered buying pressure around the 173.70 area during yesterday’s North American session, a level that is just above the 61.8% retracement of the 164.99 – 186.00 range. ETH/USD orbited the 100-bar MA (4-hourly) and 50-bar MA (4-hourly) for most of yesterday’s trading activity. One level the markets are focusing on is the 181.04 area, an area that was toppish during yesterday’s European session and one that represents the 23.6% retracement of the aforementioned range.
ETH/USD must also contend with the 200-bar MA (4-hourly) above the current market range, currently indicating around the 186.01 area. The pair is currently trading between the 50-bar MA (hourly) and 200-bar MA (hourly), and below the 100-bar MA (hourly). The 50-bar MA (hourly) and 100-bar MA (hourly) will likely provide technical Resistance before ETH/USD is able to challenge technical areas including the 181.30 area and the 183.33 area, representing the 23.6% retracement of the move from 515.88 to 80.60.
Price activity is nearest the 50-bar MA (4-hourly) at 177.35 and the 200-bar MA (Hourly) at 177.37.
Technical Support is expected around 172.88/ 167.80/ 165.25 with Stops expected below.
Technical Resistance is expected around 188.38/ 191.40/ 201.38 with Stops expected above.
On 4-Hourly chart, SlowK is Bullishly above SlowD while MACD is Bearishly below MACDAverage.
On 60-minute chart, SlowK is Bullishly above SlowD while MACD is Bullishly above MACDAverage.
