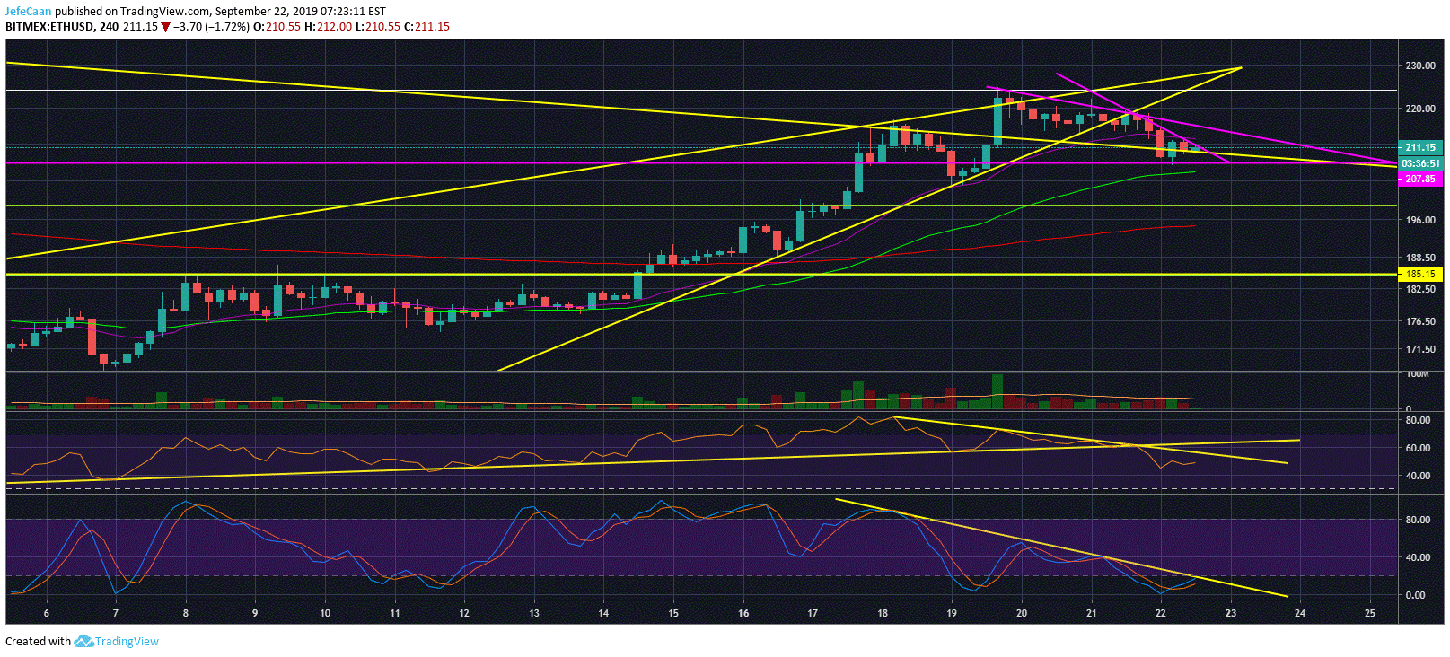
Ethereum (ETH) all set to decline below $200 as early as this week. The 4H chart for ETH/USD shows that there is now a set of two descending triangles on the chart that the price could break below. It has already broken below a larger rising wedge and is now ready to decline further within the descending channel. RSI has already declined below a key support and the Stochastic RSI is in a downtrend having now run into a trend line resistance. Volume has continued to decline over the past few days and we are now on the verge of a big move. The next support could be the 38.2% fib retracement level but the last time ETH/USD declined in this manner within the descending channel it broke straight below that support.
Bitcoin (BTC) has been trading sideways ahead of the Bakkt launch on Monday but Ethereum (ETH) made some big moves to the upside. Those moves have now been reversed for the most part and we are likely to see further downside as ETH/USD continues to decline within the descending channel. If the price breaks below the 38.2% fib retracement level, we could see it find support on the 61.8%. It might lead to the price testing the top of the descending channel once again but the downtrend is inevitable. Some traders like to think that the price has a 50-50 chance of breaking to the upside or to the downside but I don’t agree with that approach. The odds are never the same. In this case, the probability of a sharp decline far outweighs the odds of a rally to the upside. Even if the price does rally on Bakkt news it would be another unsustainable move that will only delay the inevitable.

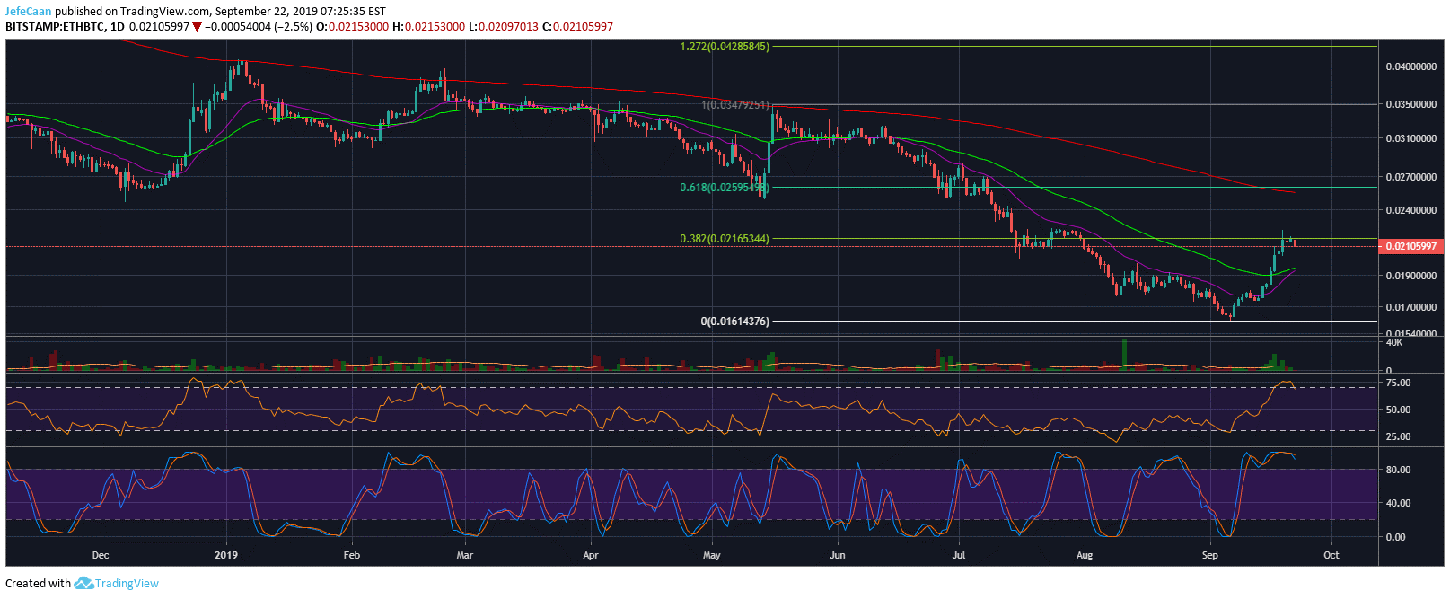
Ethereum (ETH) rallied against Bitcoin (BTC) for the past few weeks and has now run into a key resistance at the 38.2% fib retracement level. It has faced a strong rejection there and the Stochastic RSI indicates that the pair is now on the verge of a sharp decline. There are two ways in which this could happen. Either Ethereum (ETH) continues to lose against Bitcoin (BTC) as BTC/USD rises on Bakkt launch or the market falls and both lose ground but Bitcoin (BTC) holds its ground better compared to Ethereum (ETH). In my opinion, the probability of the latter happening is much higher.
The 21 day EMA has come quite close to the 50 day EMA on the daily chart for ETH/BTC but now that it has faced a strong rejection, we are not likely to see what would otherwise have been a very bullish crossover. Ethereum (ETH) has started the day in red against Bitcoin (BTC) for the first time in a week. Investors generally tend to buy the rumor and sell the news but this time a lot of people are expecting something different which is why investors have been very eager to buy the dips. Regardless of what happens short term, Ethereum (ETH) has to begin its downtrend sooner or later.
Investment Disclaimer


