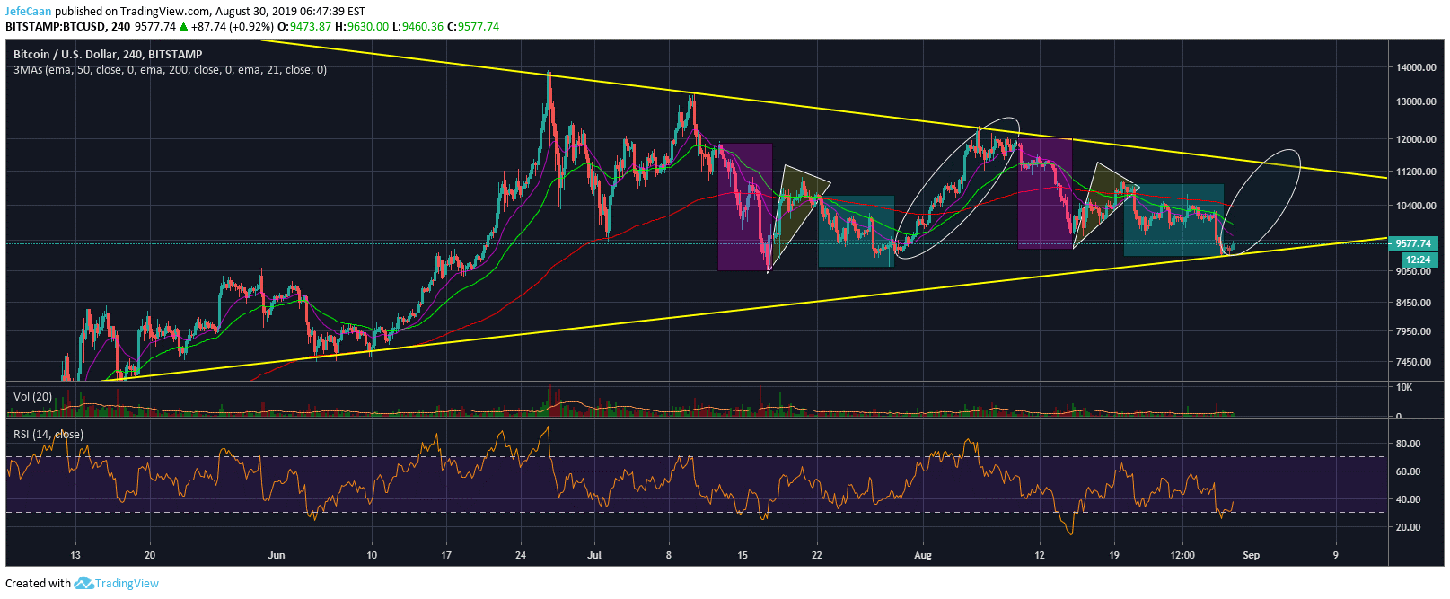
Bitcoin (BTC) is very unlikely to fall below $9,000 before rallying much higher. If we take a look at the 4H chart for BTC/USD, we can see some fractal similarities between the price action this month and that of the previous month. There is pattern of rise and fall that is shown very clearly by the chart. I don’t consider this a coincidence because all of this is staged and it has happened in the past as well. There is no reason to think that the price of Bitcoin (BTC) is controlled by retail traders when more than 90% of trading volume on even some of the largest exchanges is composed of wash trading. In addition to that, the supply of Bitcoin (BTC) is tightly concentrated in a small number of hands.

As a trader, I’m not concerned about whether that is a good thing or a bad thing, but I need to know all of this if I intend to buy or sell in this market. Now, there is a reason that the price is printing the same fractals over and over again. Yes, it has to do with algorithms and bots operated by market makers that dictate the price of Bitcoin (BTC) but why are they doing this? In my opinion this similarity in fractals could not have come at a better time from the market makers standpoint. It has a two pronged effect of making the bears scared and the bulls more confident before a major crash which we are going to see inevitably. However, before that happens, the price will rally towards the top of the symmetrical triangle again just like it did the last time.
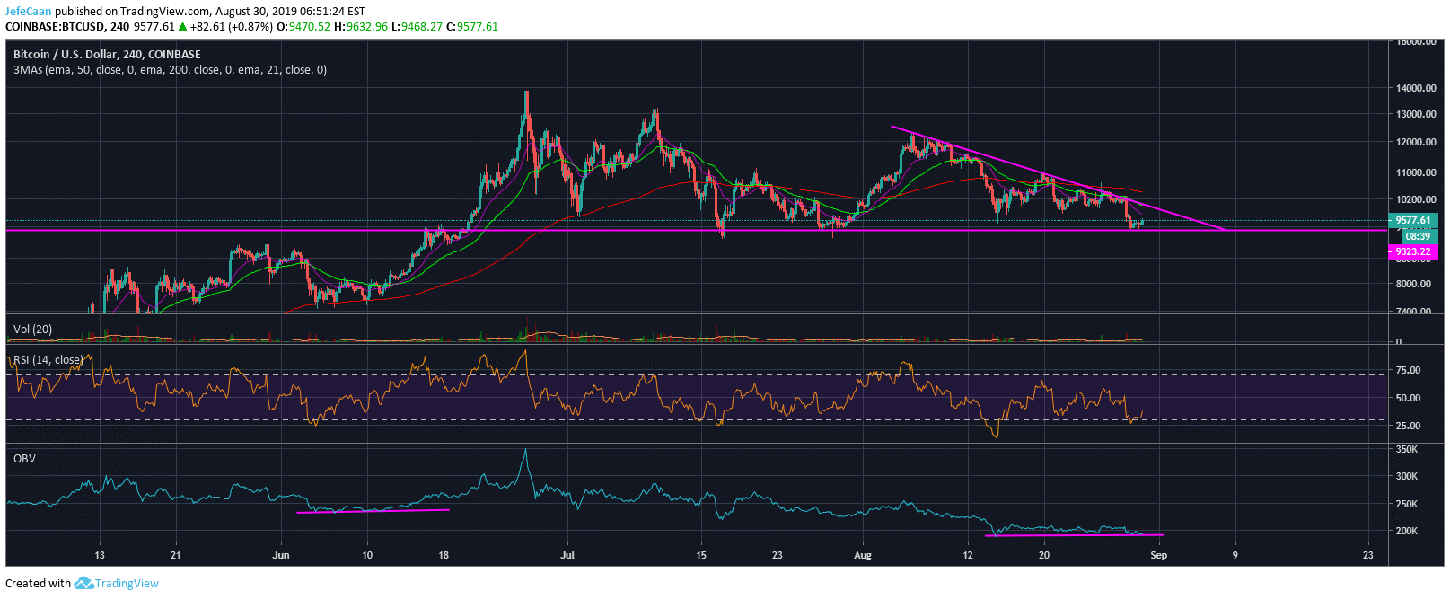
I strongly believe that before we see the price begin its sharp downtrend, the bears are going to be hunted down one last time and the bulls are going to talk about a “new yearly high” again. The 4H chart for BTC/USD shows a descending triangle that has yet to be broken to the downside. However, I do not think it will be broken to the downside. The most probable scenario in light of current market developments is that this triangle will be broken to the upside leaving the bears completely disappointed and lost for direction.
This break to the upside will also leave the bulls very optimistic which is exactly what the market makers want. They want the bears to believe that there is too much of a buying pressure for the price to fall below $9,000. As for the bulls, they will expect the price to rally towards $15,000 or higher if the price does end up breaking above the descending triangle. The OBV indicator on the 4H chart also shows a bullish divergence which is another reason to be bullish short term. It is very probable that we might see the price rally past $11,000 in the days and weeks ahead to the absolute surprise of Bitcoin (BTC) bears.