Bitcoin
Bitcoin (BTC/USD) lost some ground early in today’s Asian session as the pair depreciated to the 11,187.00 area after escalating higher to the 12,320.40 area during yesterday’s European session. Significant Stops were elected during the pair’s ascent above the 11,950.79 area during yesterday’s Asian session, a level that was a downside price objective related to the pair’s decline from the 13,202.63 area on 10 July. The significance of the 11,950 area was reaffirmed early in today’s Asian session when Bids emerged right around the 11,175 area, the next downside price objective related to the depreciation from 13,202.63.
Market sentiment has significantly improved after the pair’s test of the 9,108 area on 28 July, following its brief move below the 9,146 area that represents another important downside price objective related to the depreciation from the 13,202 level. It remains to be seen if traders will again be able to test the 11,950 area or attempt to establish a base around that area. Chartists are also paying attention to the 12,367.56 area, representing the 23.6% retracement of the 7,508.77 – 13,868.44 range.
Price activity is nearest the 200-bar MA (4-hourly) at 10,685.82 and the 100-bar MA (Hourly) at 11,217.75.
Technical Support is expected around 11,175.35/ 10,688.61/ 10,271.87 with Stops expected below.
Technical Resistance is expected around 12,367.56/ 12,873.12/ 13,488.49 with Stops expected above.
On 4-Hourly chart, SlowK is Bearishly below SlowD while MACD is Bearishly below MACDAverage.
On 60-minute chart, SlowK is Bullishly above SlowD while MACD is Bearishly below MACDAverage.
Ethereum
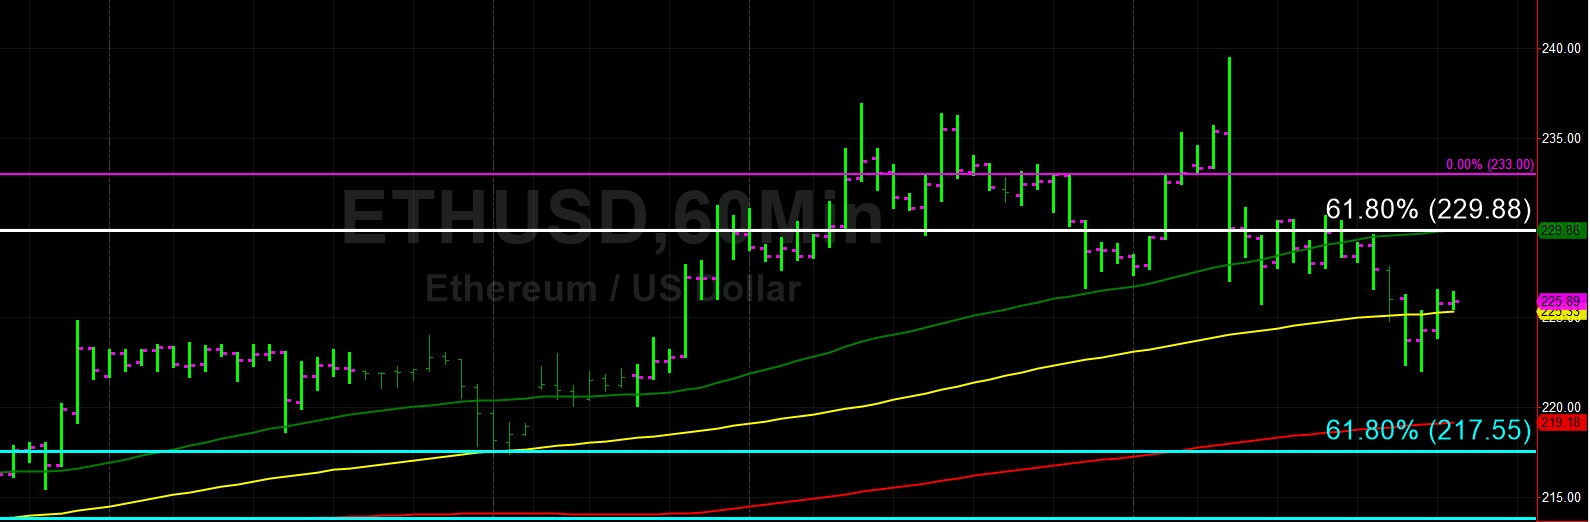
Ethereum (ETH/USD) slid lower early in today’s Asian session as the pair fell to the 225.82 area after traders took the pair as high as the 239.45 level during yesterday’s European session, a technically-significant area that is right around the 38.2% retracement of the move from 318.63 to 190.11. In addition to that level’s significance, Offers related to the 200-bar MA (4-hourly) also capped ETH/USD at yesterday’s high. During the pair’s retreat lower, the market again tested the 222.55 area, representing the 50% retracement of the 80.60 – 364.49 range.
Chartists are observing that the price has been orbiting the 100-bar MA (hourly) during the past few hours, currently indicating around the 225.33 level. Another important technical level that technicians are monitoring is the 229.88 area, representing the 61.8% retracement of the move from 322.16 to 80.60. Notably, this level is also right around the 50-bar MA (hourly). Below current market activity, traders are eyeing some technical Support around the 209 and 191 areas. Above current market activity, traders are eyeing some technical Resistance around the 246 and 258 levels.
Price activity is nearest the 50-bar MA (4-hourly) at 219.83 and the 100-bar MA (Hourly) at 225.33.
Technical Support is expected around 217.55/ 209.75/ 197.56 with Stops expected below.
Technical Resistance is expected around 239.45/ 246.88/ 257.22 with Stops expected above.
On 4-Hourly chart, SlowK is Bearishly below SlowD while MACD is Bearishly below MACDAverage.
On 60-minute chart, SlowK is Bullishly above SlowD while MACD is Bearishly below MACDAverage.