Bitcoin
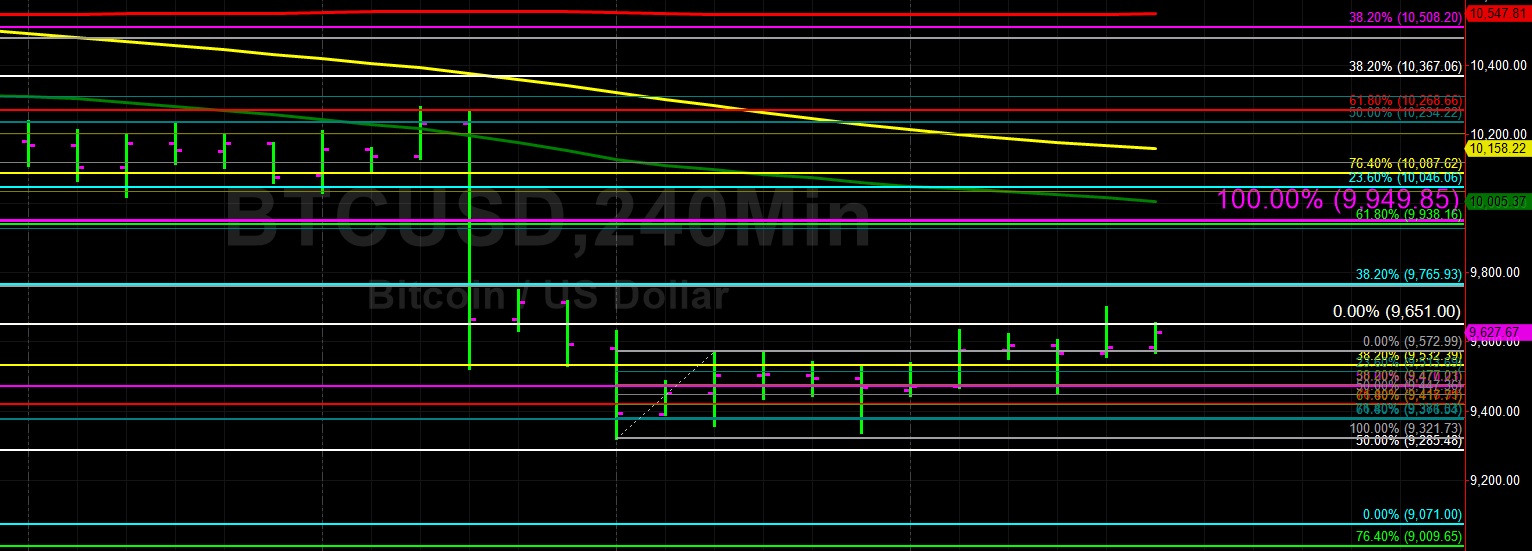
Bitcoin (BTC/USD) glided higher early in today’s Asian session as the pair traded as high as the 9649.01 area following a move to the 9699.00 level late in yesterday’s North American session. Bids emerged around the 9451.67 area during yesterday’s North American session and Bids also emerged there during yesterday’s European session. Notably, that levels represent the 50% retracement of the move from 9,321.73 to 9,572.99. During yesterday’s Asian session, the pair traded as low as the 9337.97 area before gaining ground.
If BTC/USD Bulls are able to take command in the near-term, one of the first important levels they may seek to test is the 9,765.93 area, representing the 38.2% retracement of the move from 3128.89 to 13868.44. Offers are then anticipated between the 9938 and 10046 levels and traders will pay very close attention to market activity around the psychologically-important 10000 figure. Above those areas, the 50-bar MA (4-hourly) is currently indicating around the 10005.55 level.
Price activity is nearest the 50-bar MA (4-hourly) at 10,005.55 and the 50-bar MA (Hourly) at 9,530.38.
Technical Support is expected around 9,265.49/ 8,919.72/ 8,488.00 with Stops expected below.
Technical Resistance is expected around 9,964.93/ 10,101.47/ 10,238.00 with Stops expected above.
On 4-Hourly chart, SlowK is Bullishly above SlowD while MACD is Bullishly above MACDAverage.
On 60-minute chart, SlowK is Bullishly above SlowD while MACD is Bullishly above MACDAverage.
Ethereum
Ethereum (ETH/USD) was slightly stronger early in today’s Asian session as the pair reached the 169.53 area following a move to the 165.63 area during yesterday’s North American session. Also, the pair traded as low as the 165.30 level during yesterday’s Asian session, an area that is right around the 38.2% retracement of the move from 302.20 to 80.60. During yesterday’s European session, the pair traded as high as the 170.43 area. Above that area, traders anticipate Offers between the 171.10 and 171.39 levels, but these are unlikely to be too strong because the pair traded around the 172.00 figure on 29 August.
Chartists are observing the 173.80 area as an important upside target as this was the pair’s high following its massive depreciation last week from the 185.78 area. Above the 173.80 levels, ETH/USD must get above the 175.75 and 178.62 areas with additional selling pressure expected around the 182.17 area. Additional selling pressure is expected between the 181 – 183 levels followed by Offers anticipated around the 187 – 189 areas.
Price activity is nearest the 50-bar MA (4-hourly) at 183.17 and the 50-bar MA (Hourly) at 168.71.
Technical Support is expected around 165.25/ 152.08/ 142.22 with Stops expected below.
Technical Resistance is expected around 178.77/ 181.84/ 187.46 with Stops expected above.
On 4-Hourly chart, SlowK is Bullishly above SlowD while MACD is Bullishly above MACDAverage.
On 60-minute chart, SlowK is Bullishly above SlowD while MACD is Bullishly above MACDAverage.