Sally Ho's Technical Analysis 20 August 2019
Bitcoin
Bitcoin (BTC/USD) orbited the psychologically-important 10,000 figure early in today’s Asian session as traders attempted to build upon the positive upward momentum that saw traders reclaim the 10,000 figure last weekend. The 10,508.20 level emerged as an important one late in the weekend when traders tested it, an area that represents the 38.2% retracement of the move from 5,072.01 to 13,868.44. Bids have recently emerged at multiple important technical levels over recent trading sessions, and this is indicative of a stronger upward bias.
These levels include the 9,470.23 area, representing the 50% retracement of the move from 5,072.01 to 13,868.44. Additional buying pressure also emerged around the 9,765.93 area, followed by Bids around the 9,765.93 level and the 10,087.62 area. Chartists are observing some upward price pressures around the 10,955.39 and 11,262.06 areas. Additional selling pressure is expected between the 11,262 and 11,439 areas.
Price activity is nearest the 200-bar MA (4-hourly) at 10,516.18 and the 50-bar MA (Hourly) at 10,287.61.
Technical Support is expected around 9,765.93/ 9,265.49/ 8,919.72 with Stops expected below.
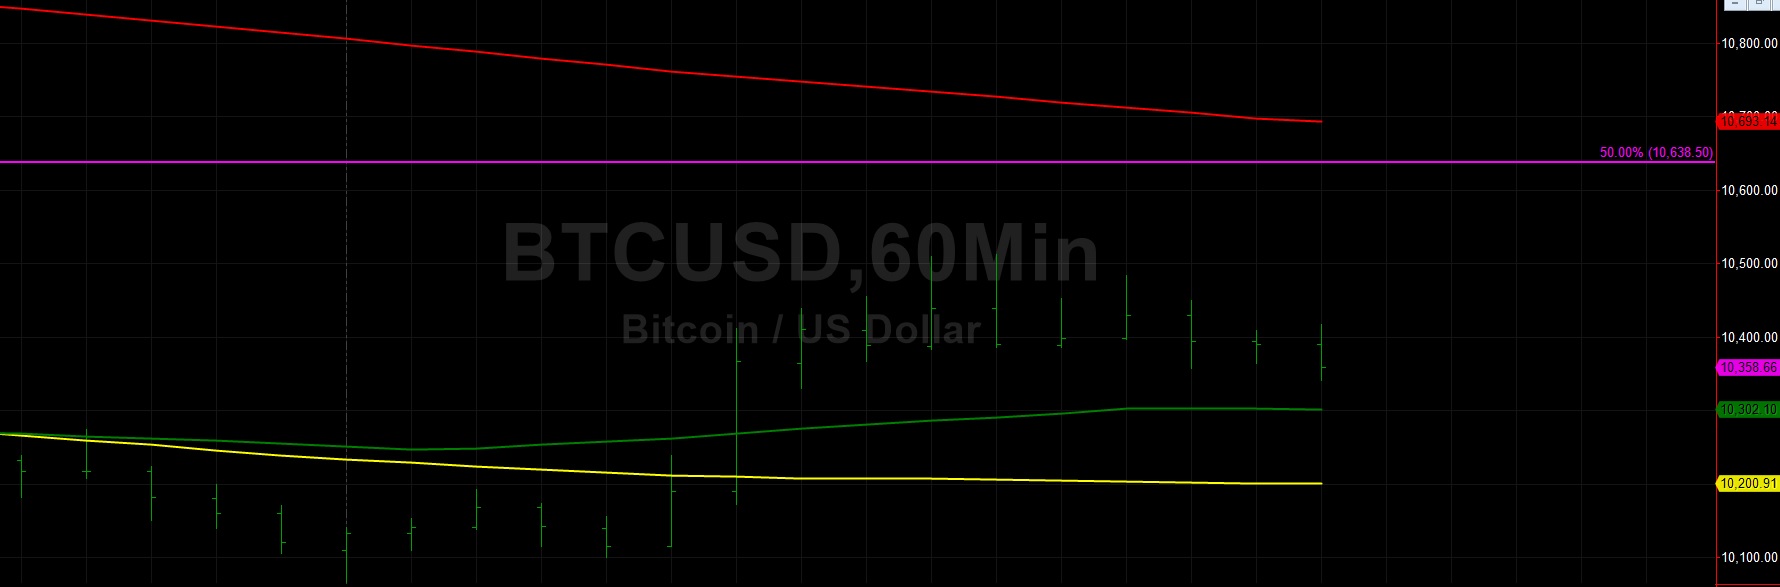
Technical Resistance is expected around 10,638.50/ 10,810.13/ 11,136.82 with Stops expected above.
On 4-Hourly chart, SlowK is Bullishly above SlowD while MACD is Bullishly above MACDAverage.
On 60-minute chart, SlowK is Bullishly above SlowD while MACD is Bearishly below MACDAverage.
Ethereum
Ethereum (ETH/USD) continued its advance towards the psychologically-important 200.00 figure early in today’s Asian session as traders sought to push market activity above this level for the first time since 14 August. The 183.33 area emerged as an important one last week as buying activity emerged around that level, representing the 23.6% retracement of the move from 515.88 to 80.60. Traders then succeeded in pushing the rate above the 100-bar MA (hourly) and traders then tested the 200-bar MA (hourly).
Chartists note that the 50-bar MA (4-hourly) emerged as a technical barrier during the move higher, and traders are attempting to establish some buying pressure above this level. The 100-bar MA (4-hourly) and 200-bar MA (4-hourly) are also upside price targets that traders will need to challenge, along with the 209.75 area that represents the 23.6% retracement of the move from 627.83 to 80.60. Selling pressure and Offers are anticipated between the 217.55 and 220.40 areas.
Price activity is nearest the 50-bar MA (4-hourly) at 197.73 and the 200-bar MA (Hourly) at 197.65.
Technical Support is expected around 178.47/ 165.25/ 157.28 with Stops expected below.
Technical Resistance is expected around 201.38/ 206.18/ 217.55 with Stops expected above.
On 4-Hourly chart, SlowK is Bullishly above SlowD while MACD is Bullishly above MACDAverage.
On 60-minute chart, SlowK is Bullishly above SlowD while MACD is Bullishly above MACDAverage.
