Bitcoin
Bitcoin (BTC/USD) scored decent gains early in today’s Asian session as the pair escalated higher to the 10,497.00 figure, just below the 10,508.20 area that represents the 38.2% retracement of the 5,072.01 – 13,868.44 range. Prior to testing this important level, the pair traded as high as the 10,348.41 level during yesterday’s North American session, right around the 38.2% retracement of the move from 4,702.53 to 13,868.44. The pair’s testing of those levels and technical Support above the 10,271 level suggest an upside short-term bias that could propel market activity higher.
BTC/USD traded above and below its 100-bar MA (4-hourly) for much of yesterday’s Asian and European sessions before decisive buying activity pushed the pair higher early in today’s Asian session. The 10,548 area remains an upside price extension price objective related to the pair’s recent high of 13,202.63. The significance of the 10,548 area was confirmed when the market twice tested the 9,146 area on 17 July and 28 July during the pair’s gyrations below the psychologically-important 10,000 figure. Above that area, the 11,032 level remains technically-significant, with the 10,668 and 10,810 areas as more immediate targets.
Price activity is nearest the 200-bar MA (4-hourly) at 10,681.86 and the 50-bar MA (Hourly) at 9,946.78.
Technical Support is expected around 9,671.29/ 9,442.20/ 9,285.48 with Stops expected below.
Technical Resistance is expected around 10,508.20/ 10,810.13/ 11,136.82 with Stops expected above.
On 4-Hourly chart, SlowK is Bullishly above SlowD while MACD is Bullishly above MACDAverage.
On 60-minute chart, SlowK is Bearishly below SlowD while MACD is Bullishly above MACDAverage.
Ethereum
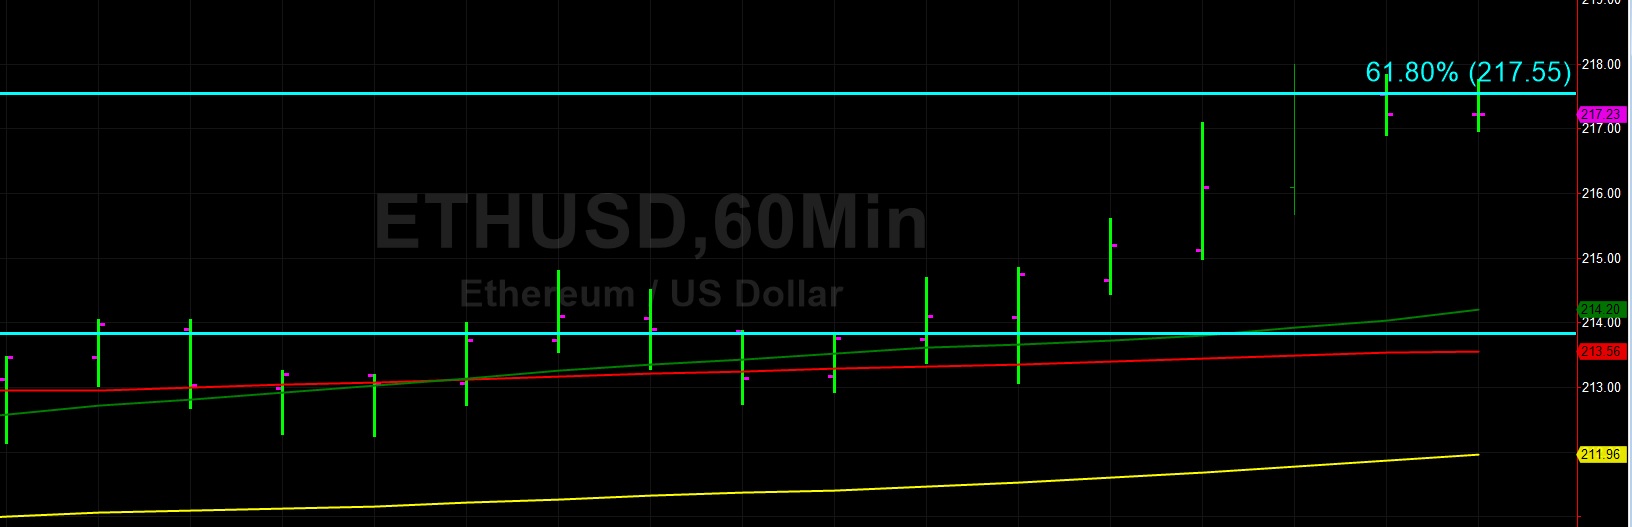
Ethereum (ETH/USD) earned back some of yesterday’s losses as the pair gained ground and traded higher around the 218.00 figure after orbiting the 50-bar MA (4-hourly) during yesterday’s European and North American sessions. During yesterday’s Asian session, the pair moved below the 50-bar MA (4-hourly) but Bids emerged above the 209.75 level, representing the 23.6% retracement of the move from 627.87 to 80.60, and also emerged around the 100-bar MA (4-hourly) early in today’s Asian session.
Another positive development emerged when the 50-bar MA (hourly) crossed above the 200-bar MA (4-hourly) early in yesterday’s North American session. The 100-bar MA (hourly) and the 200-bar MA (hourly) appear to be converging, and a crossover could also result in additional upside gains. Technicians are eyeing some upside technical price objectives including the 220.44 level which represents the 23.6% retracement of the move from 318.63 to 190.11 and the 222.55 area which represents the 50% retracement of the move from 80.60 to 364.49.
Price activity is nearest the 100-bar MA (4-hourly) at 215.54 and the 50-bar MA (Hourly) at 214.21.
Technical Support is expected around 206.18/ 197.56 / 191.40 with Stops expected below.
Technical Resistance is expected around 226.56/ 235.31/ 239.20 with Stops expected above.
On 4-Hourly chart, SlowK is Bullishly above SlowD while MACD is Bullishly above MACDAverage.
On 60-minute chart, SlowK is Bullishly above SlowD while MACD is Bullishly above MACDAverage.