Sally Ho's Technical Analysis 19 August 2019
Bitcoin
Bitcoin (BTC/USD) continued to try to gain ground above the psychologically-important 10,000 figure early in today’s Asian session as the pair built upon Bids that emerged around the 10,066.66 level during yesterday’s European session. This level was above the 10,046.06 area, representing the 23.6% retracement of the 13,202.63 – 9,071.00 range, and Bids later emerged above the 10,087.62 area, representing the 76.4% retracement of the move from 8,919.72 to 13,868.44. Additional Bids then emerged around the 10,367.06 area during yesterday’s North American session, representing the 38.2% retracement of the move from 4,702.53 to 13,868.44.
Technical Support that has been derived from Bids at important retracement levels has resulted in price appreciation, and this typically suggests additional appreciation in the short-term. Some Offers emerged around the 10,508.20 area during yesterday’s North American session, right around the 38.2% retracement of the move from 5,072.01 to 13,868.44. The 200-bar MA (4-hourly) is also indicating around this level. Chartists are observing upside price objectives around the 10,649 and 10,688 levels.
Price activity is nearest the 200-bar MA (4-hourly) at 10,516.18 and the 50-bar MA (Hourly) at 10,287.61.
Technical Support is expected around 9,765.93/ 9,265.49/ 8,919.72 with Stops expected below.
Technical Resistance is expected around 10,638.50/ 10,810.13/ 11,136.82 with Stops expected above.
On 4-Hourly chart, SlowK is Bullishly above SlowD while MACD is Bullishly above MACDAverage.
On 60-minute chart, SlowK is Bullishly above SlowD while MACD is Bearishly below MACDAverage.
Ethereum
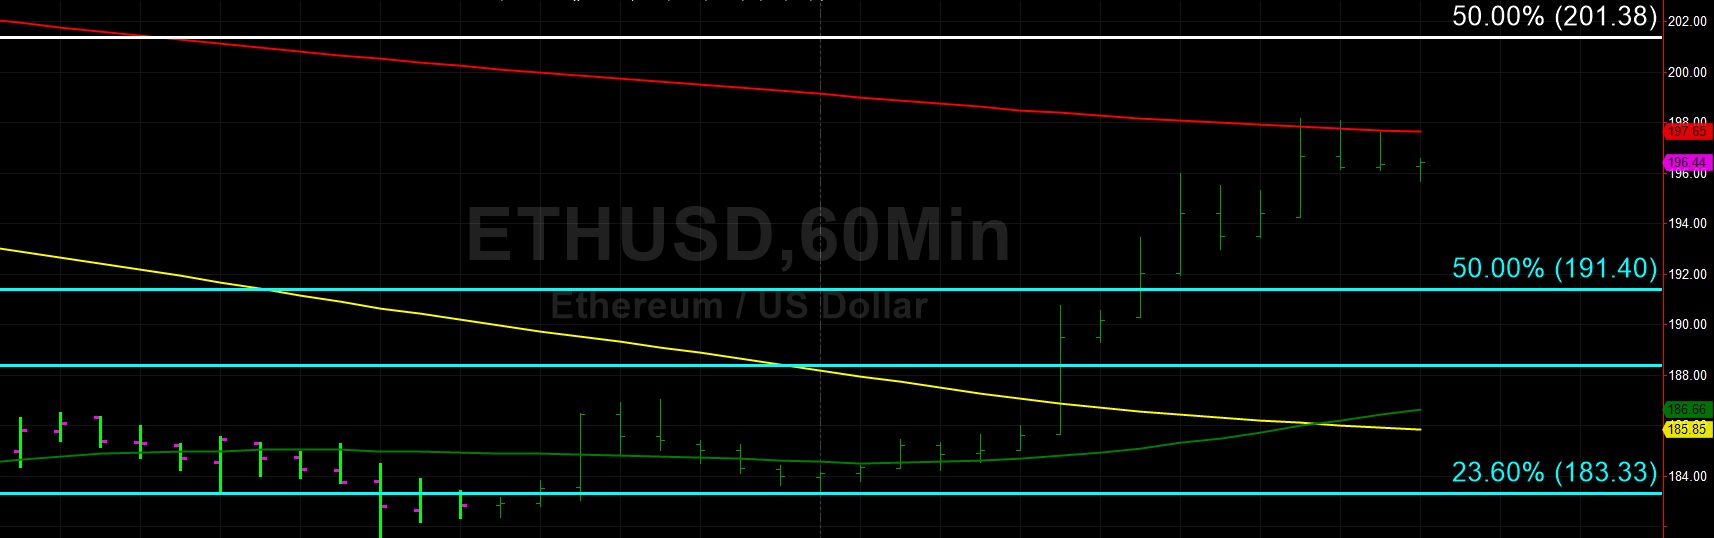
Ethereum (ETH/USD) continued to push higher towards the psychologically-important 200.00 figure during yesterday’s North American session after Bids emerged around the 183.33 level during yesterday’s European session, a level that is right around the 23.6% retracement of the move from 515.88 to 80.60. The pair then jumped higher and tested the 197.56 area, representing the 76.4% retracement of the move from 146.00 to 364.49.
ETH/USD’s short-term bias appears to be upward, especially given the Bids that emerged around the 183.33 level and the 190.11 level. Chartists are observing some upside price objectives around the 202.27 and 206.18 levels. Before traders challenge those areas, however, market activity must advance above the 50-bar MA (4-hourly), currently indicating around the 197.73 area. Another important target that traders are watching is the 209.75 area, representing the 23.6% retracement of the move from 627.83 to 80.60.
Price activity is nearest the 50-bar MA (4-hourly) at 197.73 and the 200-bar MA (Hourly) at 197.65.
Technical Support is expected around 178.47/ 165.25/ 157.28 with Stops expected below.
Technical Resistance is expected around 201.38/ 206.18/ 217.55 with Stops expected above.
On 4-Hourly chart, SlowK is Bullishly above SlowD while MACD is Bullishly above MACDAverage.
On 60-minute chart, SlowK is Bullishly above SlowD while MACD is Bullishly above MACDAverage.
