Bitcoin
Bitcoin (BTC/USD) appreciated early in today’s Asian session as the pair escalated higher to the 10,321.01 level after steady buying activity emerged during yesterday’s European and North American sessions. The pair has traded as low as the 9,470.00 level this week, its weakest print since late July and a level that is right around the 50% retracement of the move from 5,072.01 to 13,868.44. BTC/USD continues to trade below its 50-bar MA (4-hourly), 100-bar MA (4-hourly), and 200-bar MA (4-hourly), and is trading between its 50-bar MA (hourly) and 100-bar MA (hourly). Following the pair’s recent sell-off, traders are looking to see if the pair can establish a base above its 50-bar MA (hourly).
Below current market activity, the 9,921, 9,758, and 9,689 areas were levels that traders challenged on the downside, triggering Stops below. Above current market activity, the 10,548.63 and 11,032.37 were downside price objectives that BTC/USD Bulls will attempt to test again. The pair’s bias will likely remain negative in the short-term, and will partially be determined by how well the pair trades around the psychologically-important 10,000 figure.
Price activity is nearest the 200-bar MA (4-hourly) at 10,529.26 and the 100-bar MA (Hourly) at 10,518.90.
Technical Support is expected around 9,765.93/ 9,265.49/ 8,919.72 with Stops expected below.
Technical Resistance is expected around 10,638.50/ 10,810.13/ 11,136.82 with Stops expected above.
On 4-Hourly chart, SlowK is Bullishly above SlowD while MACD is Bullishly above MACDAverage.
On 60-minute chart, SlowK is Bullishly above SlowD while MACD is Bullishly above MACDAverage.
Ethereum
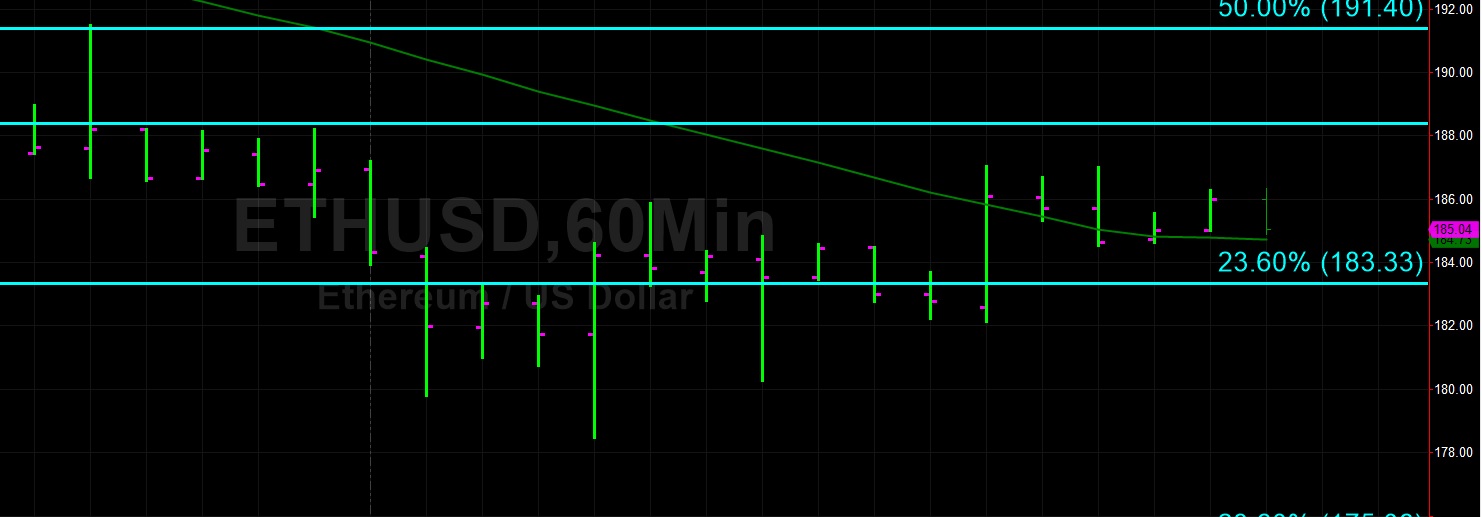
Ethereum (ETH/USD) gained a little bit of ground early in today’s Asian session as the pair climbed higher to the 187.00 figure after Bids emerged around the 178.47 area during yesterday’s European session. The pair traded as low as the 171.00 figure this week, its weakest showing since May and a level that was reached after the pair traded as high as the 216.58 area last weekend. Significant Stops were elected below the 195.31 and 189.05 areas during the pair’s move lower this week, both of which were downside price extension objectives related to the pair’s June high of 364.49.
Chartists observe that the pair continues to trade below its 50-bar MA (4-hourly), 100-bar MA (4-hourly), 200-bar MA (4-hourly), 50-bar MA (hourly), 100-bar MA (hourly), and 200-bar MA (hourly). Another important level that traders are watching is the 165.25 area, a downside price extension objective. Additionally, the 157.28 area is another downside price extension objective that chartists are paying close attention to, given the pair’s ongoing weak sentiment.
Price activity is nearest the 50-bar MA (4-hourly) at 203.32 and the 50-bar MA (Hourly) at 184.73.
Technical Support is expected around 178.47/ 165.25/ 157.28 with Stops expected below.
Technical Resistance is expected around 197.56/ 206.18/ 217.55 with Stops expected above.
On 4-Hourly chart, SlowK is Bullishly above SlowD while MACD is Bullishly above MACDAverage.
On 60-minute chart, SlowK is Bullishly above SlowD while MACD is Bullishly above MACDAverage.