Bitcoin
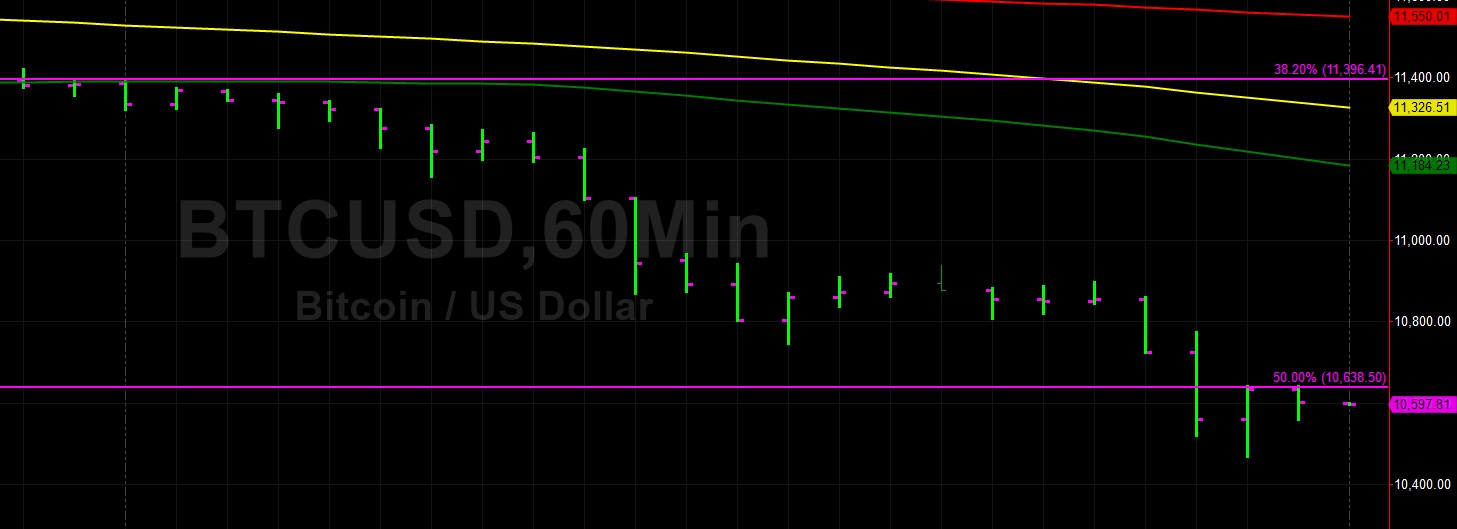
Bitcoin (BTC/USD) extended recent losses early in today’s Asian session as the pair traded as low as the 10,467.77 level after Stops were elected below the 10,508.20 area, representing the 38.2% retracement of the move from 5,072.01 to 13,868.44. The market blew through the 11,136 and 11,624 areas that have recently represented technical Support and technical Resistance for the pair, and technicians are observing key areas below and above those levels. Significant Stops were also elected below the 10,955.39 area, a key retracement level.
Also, the 10,810.13 level represents the 61.8% retracement of the move from 8,919.72 to 13,868.44, and sizable Stops were triggered below this area. Above current market activity, the 11,705/ 11,759/ 11,978 levels represent technical Resistance, and each of those areas is above the 50-bar MA (4-hourly). Below market activity, the 10,367 and 10,087 levels represent downside technical Support.
Price activity is nearest the 200-bar MA (4-hourly) at 10,624.81 and the 50-bar MA (Hourly) at 11,200.18.
Technical Support is expected around 10,367.06/ 10,271.87/ 10,087.62 with Stops expected below.
Technical Resistance is expected around 10,810.13/ 10,955.38/ 11,136.82 with Stops expected above.
On 4-Hourly chart, SlowK is Bearishly below SlowD while MACD is Bearishly below MACDAverage.
On 60-minute chart, SlowK is Bullishly above SlowD while MACD is Bearishly below MACDAverage.
Ethereum
Ethereum (ETH/USD) continues to attempt to establish new ground above the psychologically-important 200.00 figure but has remained in a relatively tight range over the past several trading sessions, with the 202.27 level serving as important technical Support. If ETH/USD is able to gain additional ground, its first major challenge will be the 226.56 area, with Offers expected between the 235 and 239 levels.
Technicians note that the 50-bar MA (4-hourly), 100-bar MA (4-hourly), and 200-bar MA (4-hourly) are converging above current market activity, and this may have a negative impact on market sentiment. If selling pressure emerges, technicians will continue to anticipate some technical Support around the 202.27 level, an area where Bids have recently emerged. Below that level, the 197.56 and 191.40 areas are levels where additional technical Support is likely to emerge.
Price activity is nearest the 50-bar MA (4-hourly) at 216.25 and the 50-bar MA (Hourly) at 209.92.
Technical Support is expected around 202.27/ 197.56/ 191.40 with Stops expected below.
Technical Resistance is expected around 222.55/ 229.46/ 239.45with Stops expected above.
On 4-Hourly chart, SlowK is Bullishly above SlowD while MACD is Bearishly below MACDAverage.
On 60-minute chart, SlowK is Bullishly above SlowD while MACD is Bullishly above MACDAverage.