Sally Ho's Technical Analysis 12 August 2019
Bitcoin
Bitcoin (BTC/USD) searched for a fresh market bias early in today’s Asian session as the pair continues to take cues from important technical levels. During yesterday’s European session, the pair fell sharply to the 11,088.88 area before bouncing higher, a level that is right around the 38.2% retracement of the move from 6,600.00 to 13,868.44. BTC bulls continue to try to establish a base around the psychologically-important 12,000 figure, a possibility especially after several recent tests of the technically-important 11,978.03 area, representing the 38.2% retracement of the move from 8,919.72 to 13,868.44. Likewise, BTC/USD Bulls are trying to establish technical Bids above the 50-bar MA (4-hourly) and 100-bar MA (4-hourly).
Stops were elected below the 11,439 and 11,394 areas during yesterday’s move lower, both of which represent important technical levels. Additionally, the 50-bar MA (4-hourly) continues to climb, and this may be supportive of BTC/USD in the short-term. Chartists also continue to eye the 11,950.79 level, representing the 76.4% retracement of the move from 13,204.24 to 7,893.01.
Price activity is nearest the 50-bar MA (4-hourly) at 11,535.21 and the 50-bar MA (Hourly) at 11,513.23.
Technical Support is expected around 11,175.35/ 10,688.61/ 10,271.87 with Stops expected below.
Technical Resistance is expected around 12,367.56/ 12,873.12/ 13,488.49 with Stops expected above.
On 4-Hourly chart, SlowK is Bearishly below SlowD while MACD is Bearishly below MACDAverage.
On 60-minute chart, SlowK is Bearishly below SlowD while MACD is Bullishly above MACDAverage.
Ethereum
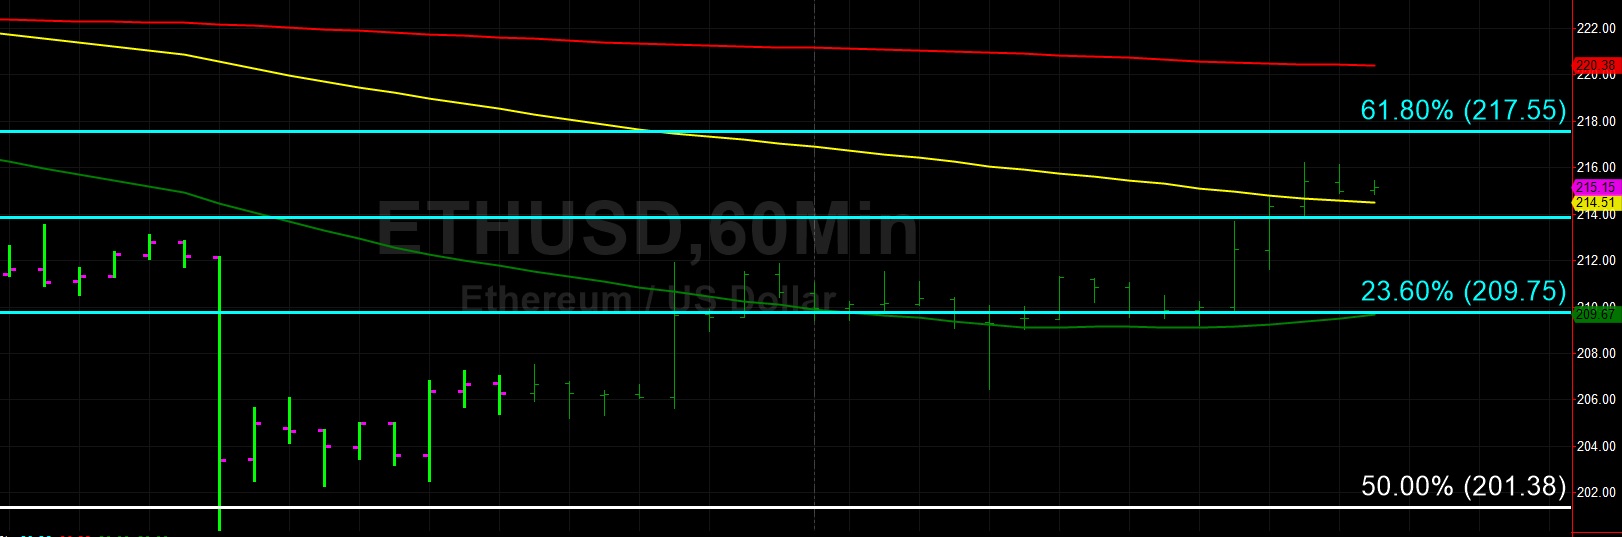
Ethereum (ETH/USD) sought fresh market sentiment early in today’s Asian session as the pair continues to trade above the psychologically-important 200.00 figure and orbit the 209.75 level, representing the 23.6% retracement of the move from 627.83 to 80.60. The move to 200.38 during Saturday’s European session was abrupt and some Stops were elected below the 202.27 level. Market bias may continue to weaken given the pair’s gyrations below the 50-bar MA (4-hourly), 100-bar MA (4-hourly), and 200-bar MA (4-hourly), levels that will render it more challenging to make progress on the upside.
Chartists observe that the 223.22 level represents the 38.2% retracement of the move from 197.00 to 239.45. Given the pair’s recent move lower, it will become increasingly difficult for ETH/USD Bulls to push the pair higher. If sentiment continues to weaken for ETH/USD, traders are observing technical Support around the 202 and 197 areas, with stronger Bids expected around the 191.40 level. On the upside, the 224.59 and 227.43 levels represent technical Resistance for the pair.
Price activity is nearest the 100-bar MA (4-hourly) at 216.99 and the 100-bar MA (Hourly) at 214.51.
Technical Support is expected around 202.27/ 197.56/ 191.40 with Stops expected below.
Technical Resistance is expected around 222.55/ 229.46/ 239.45with Stops expected above.
On 4-Hourly chart, SlowK is Bullishly above SlowD while MACD is Bullishly above MACDAverage.
On 60-minute chart, SlowK is Bearishly below SlowD while MACD is Bullishly above MACDAverage.
