Sally Ho's Technical Analysis 9 July 2019
Bitcoin
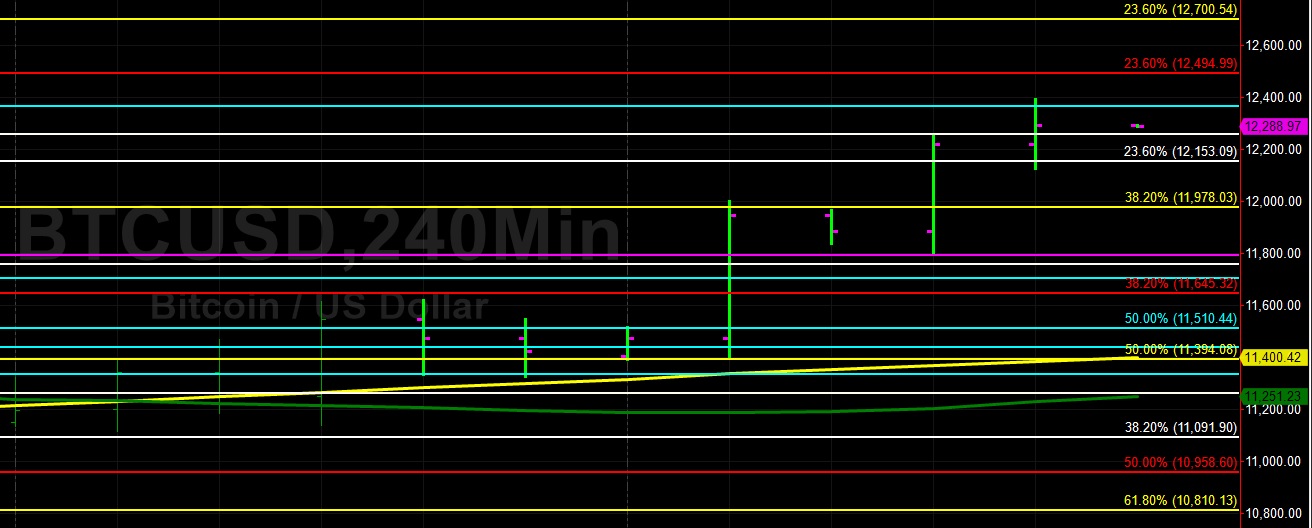
Bitcoin (BTC/USD) strengthened early in today’s Asian session as the pair traded as high as the 12,356.98 area after steady buying interest commenced during yesterday’s Asian session. The pair tested the 12,367.56 area, representing the 23.6% retracement of the 7,508.77 – 13,868.44 range. Many chartists expect that level will soon be breached with the next key upside levels being around the 12,494.99 and 12,700.54 areas. The pair managed to find some technical Support around the 100-bar MA (4-hourly) during yesterday’s Asian and European sessions.
BTC/USD bulls are eyeing a couple of additional upside price targets including the 12,873.12 area, representing the 76.4% retracement of the move from 13,868.44 to 9,651.00. Stops were elected above two other price levels related to that range during yesterday’s activity including 11,759.72 and 12,257.38. If BTC/USD is going to challenge its 2019 high print of 13,868.44, it must first get through technical Resistance around the 13,488.49 area, representing the 61.8% retracement of the move from 19,891.99 to 3,128.89.
Price activity is nearest the 100-bar MA (4-hourly) at 11,386.59 and the 50-bar MA (Hourly) at 11,533.95.
Technical Support is expected around 11,759.72/ 11,091.90/ 10,810.13 with Stops expected below.
Technical Resistance is expected around 12,700.54/ 13,488.49/ 13,868.44 with Stops expected above.
On 4-Hourly chart, SlowK is Bullishly above SlowD while MACD is Bullishly above MACDAverage.
On 60-minute chart, SlowK is Bullishly above SlowD while MACD is Bullishly above MACDAverage.
Ethereum
Ethereum (ETH/USD) appreciated early in today’s Asian session, trading as high as the 315.00 figure after decent buying activity started during yesterday’s Asian session. Some Stops were elected above the 314.00 level during the move higher, representing the 50% retracement of the move from 547.54 to 80.60. The next upside price target related to this range is the 369.08 level and the next downside price target related to this range is the 258.92 area.
ETH/USD has managed to find some demand around the 306.35 level in recent sessions, representing the 38.2% retracement of the 364.49 – 270.42 range. The next upside price target related to this range is the 317.47 area followed by the 328.56 level, and the next downside price target related to this range is the 292.62 area. Chartists are closely monitoring the 314.14 area, as it represents the 50% retracement of the 364.49 – 270.42 range.
Price activity is nearest the 100-bar MA (4-hourly) at 302.67 and the 50-bar MA (Hourly) at 301.00.
Technical Support is expected around 298.24/ 289.64/ 272.56 with Stops expected below.
Technical Resistance is expected around 322.16/ 328.56/ 342.29 with Stops expected above.
On 4-Hourly chart, SlowK is Bullishly above SlowD while MACD is Bullishly above MACDAverage.
On 60-minute chart, SlowK is Bullishly above SlowD while MACD is Bullishly above MACDAverage.
