Bitcoin
Bitcoin (BTC/USD) appreciated early in today’s Asian session as the pair climbed to the 9839.83 area following its recent dive below the psychologically-important 10,000 figure. The move higher challenged the 100-bar MA (4-hourly) that has kept the pair pressured for several trading sessions and this technical Resistance has driven the pair lower to test some technical Support, including the 9285.48 area that represents the 50% retracement of the move from 4,702.53 to 13,868.44. The pair’s next upside price objective related to this range is 10,367.06 and the pair’s next downside price objective related to this range is 8,203.91.
If market sentiment remains relatively bearish with BTC/USD below 10,000, the pair is likely to encounter some additional technical Resistance above current market activity. Traders absorbed one layer of technical Resistance around 9,765.93 area, representing the 38.2% retracement of the move from 3,128.29 to 13,868.44. Additional upside areas where Offers are likely in place include the 10,048, 10,087, and 10,234 areas. The 100-bar MA (4-hourly) is now indicating around the 10,062 area and may also keep the pair’s upside in check.
Price activity is nearest the 50-bar MA (4-hourly) at 9,760.62 and the 200-bar MA (Hourly) at 9,778.32.
Technical Support is expected around 9,442.20/ 9,285.48/ 9,071.00 with Stops expected below.
Technical Resistance is expected around 10,268.07/ 10,508.20/ 10,958.60 with Stops expected above.
On 4-Hourly chart, SlowK is Bullishly above SlowD while MACD is Bullishly above MACDAverage.
On 60-minute chart, SlowK is Bearishly below SlowD while MACD is Bullishly above MACDAverage.
Ethereum
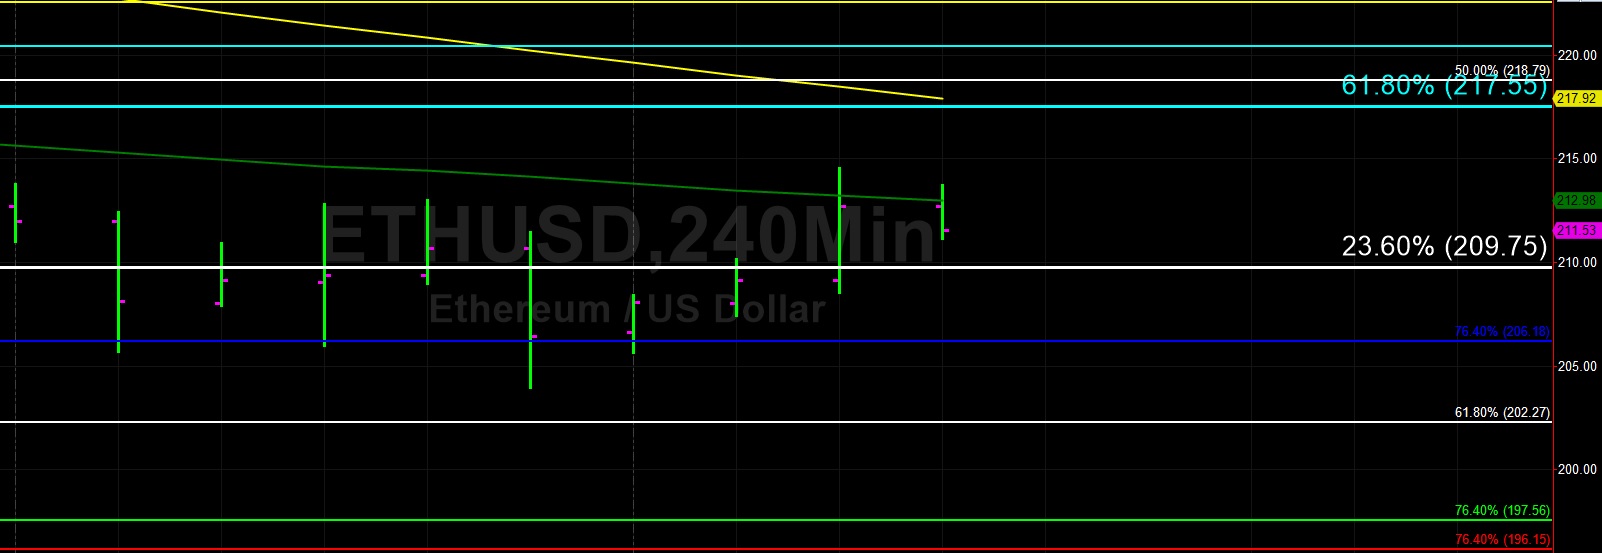
Ethereum (ETH/USD) faded early in today’s Asian session as market activity continues to orbit some key technical levels following its recent test of the psychologically-important 200.00 figure. One area the market continues to focus on is the 209.75 area, representing the 23.6% retracement of the move from 627.83 to 80.60. The pair’s recent low around the 197.00 figure was just below the 76.4% retracement of the move from 146.00 to 364.49. The pair also continues to orbit the 50-bar MA (4-hourly)
ETH/USD continues to trade below its 100-bar MA (4-hourly) and its 200-bar MA (4-hourly) and hovering around its 50-bar MA (4-hourly). Also, the pair has recently traded between its 50-bar MA (hourly) and its 100-bar MA (hourly), evidencing its lack of clear short-term direction. If the 50-bar MA (hourly) is able to converge and cross above the 100-bar MA (hourly) and 200-bar MA (hourly), it may lead to a bullish short-term bias. Above current market activity, technicians are eyeing some technical Resistance around the 229 and 235 areas. Below current market activity, technicians are plotting some technical Support around the 191 and 181 areas.
Price activity is nearest the 50-bar MA (4-hourly) at 212.98 and the 100-bar MA (Hourly) at 211.11.
Technical Support is expected around 197.56 / 191.40/ 183.33 with Stops expected below.
Technical Resistance is expected around 222.55/ 229.46/ 233.00 with Stops expected above.
On 4-Hourly chart, SlowK is Bullishly above SlowD while MACD is Bullishly above MACDAverage.
On 60-minute chart, SlowK is Bearishly below SlowD while MACD is Bullishly above MACDAverage.