Bitcoin
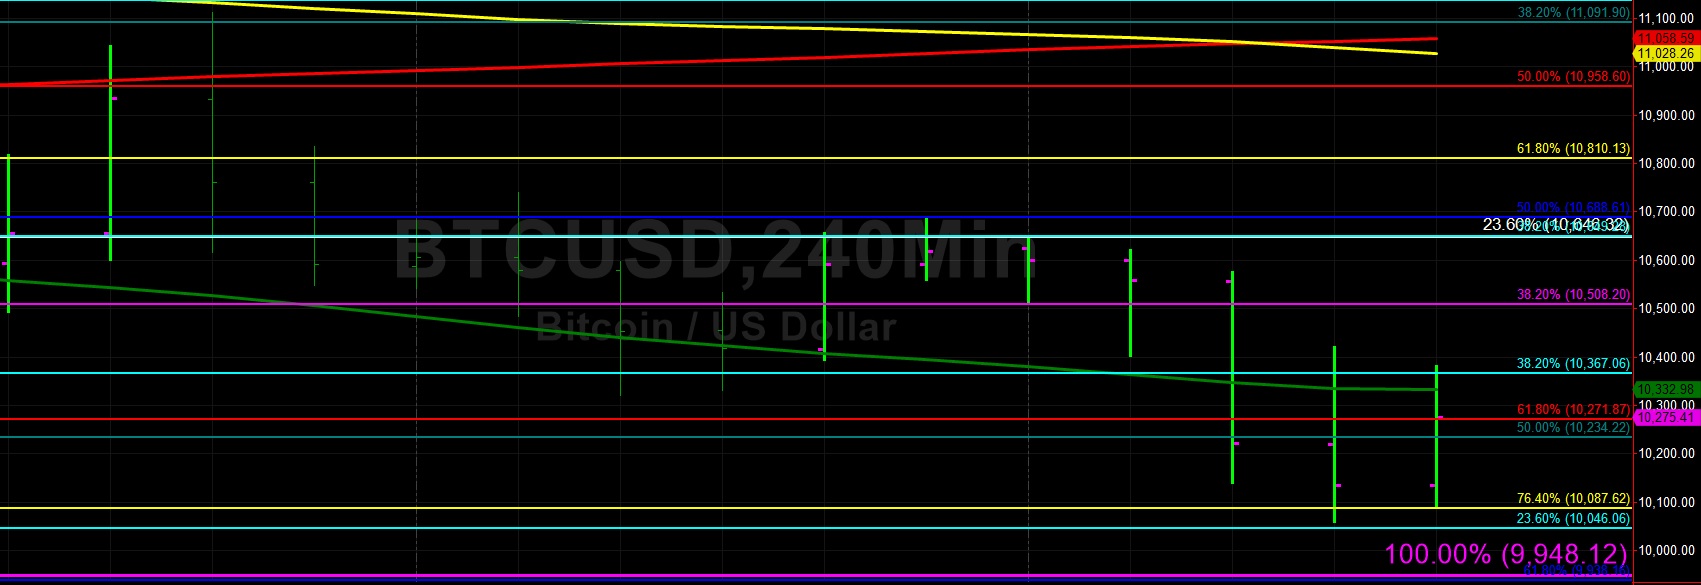
Bitcoin (BTC/USD) saw some initial buying activity early in today’s Asian session as the pair moved higher to the 10,371.95 area after trading as low as the 10,060.00 area during yesterday’s North American session. BTC/USD appreciated to the 10,688.14 level during yesterday’s Asian session, right around the 50% retracement of the move from 7,508.88 to 13,868.44. The pair’s next upside retracement level related to this range is the 11,439.05 area and the next downside retracement level related to this range is the 9,938.16 area.
Stops were elected below the 50-bar MA (4-hourly) during yesterday’s North American session, and Bids emerged above the 10,046.06 area, representing the 23.6% retracement of the move from 13,202.63 to 9,071.00. Early in today’s Asian session, the pair moved to the 10,367.06 area, representing the 38.2% retracement of the same range. This is an indication that traders are paying close attention to this range, and the next upside level related to this range is the 11,136.82 area. A couple of additional key levels are 10,810 and 10,958, with the 100-bar MA (4-hourly) and 200-bar MA (4-hourly) converging just above these prices.
Price activity is nearest the 50-bar MA (4-hourly) at 10,334.27 and the 200-bar MA (Hourly) at 10,334.08.
Technical Support is expected around 10,046.06/ 9,532.39/ 9,071.00 with Stops expected below.
Technical Resistance is expected around 11,202.00/ 11,510.44/ 12,227.57 with Stops expected above.
On 4-Hourly chart, SlowK is Bearishly below SlowD while MACD is Bearishly below MACDAverage.
On 60-minute chart, SlowK is Bullishly above SlowD while MACD is Bearishly below MACDAverage.
Ethereum
Ethereum (ETH/USD) reversed some of yesterday’s losses and appreciated early in today’s Asian session as the pair moved higher to the 218.58 area, a technical level that is just below the 50% retracement of the move from 148.81 to 288.77. The next downside retracement level related to this range is the 202.27 area and the next upside retracement level related to this range is the 228.32 area. ETH/USD traded as low as the 211.45 area during yesterday’s North American session following consistent selling pressure.
ETH/USD was capped around the 228.28 area during yesterday’s Asian session, representing the 61.8% retracement of the move from 144.15 to 364.49. Sentiment gradually weakened during yesterday’s European and North American sessions and the 50-bar MA (4-hourly) eventually yielded way to the downside during yesterday’s European sessions. Chartists are eyeing some key technical levels including the 209.75 and 191.40 while some notable upside technical levels include the 229.46 and 246.88 areas.
Price activity is nearest the 50-bar MA (4-hourly) at 220.86 and the 200-bar MA (Hourly) at 220.94.
Technical Support is expected around 206.18/ 191.40/ 183.33 with Stops expected below.
Technical Resistance is expected around 229.46/ 242.85/ 257.22 with Stops expected above.
On 4-Hourly chart, SlowK is Bearishly below SlowD while MACD is Bearishly below MACDAverage.
On 60-minute chart, SlowK is Bullishly above SlowD while MACD is Bearishly below MACDAverage.