Bitcoin
Bitcoin (BTC/USD) appreciated early in today’s Asian session and moved higher to the 10,597.00 level, its strongest print after crashing below the 100-bar MA (4-hourly) during yesterday’s North American session. Stops were reached after the pair moved below the 100-bar MA (4-hourly) around the 10,515 level, taking the pair to its lowest level of the day around the 9953.00 area. Several important areas of Stops were elected during the pair’s move lower yesterday, including below downside price extension objectives around the 10,637 and 10,267 levels.
Notably, Bids emerged around the 9953 area during yesterday’s pullback, just above a historical relative high around the 9948 area. Chartists are eyeing the 9671 area as an additional downside extension price objective in the event BTC/USD consolidates additional recent gains. Above current market activity, technical Resistance may be in place around the 10,935 and 11,055 levels. Also, the 11,142.15 area represents the 23.6% retracement of the move from 13,868.44 to 10,300.00 and that area is also near the 50-bar MA (hourly), around the 11,140 area now.
Price activity is nearest the 100-bar MA (4-hourly) at 10,549.58 and the 50-bar MA (Hourly) at 11,140.65.
Technical Support is expected around 9953.00/ 9765.93/ 9671.29 with Stops expected below.
Technical Resistance is expected around 11,142.15/ 11,663.14/ 12,084.22 with Stops expected above.
On 4-Hourly chart, SlowK is Bullishly above SlowD while MACD is Bearishly below MACDAverage.
On 60-minute chart, SlowK is Bullishly above SlowD while MACD is Bullishly above MACDAverage.
Ethereum
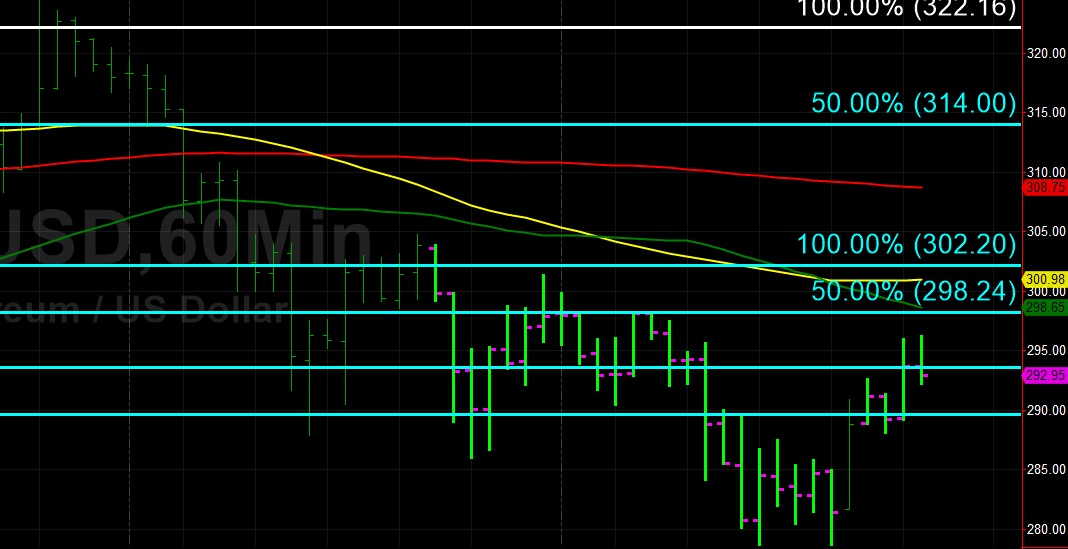
Ethereum (ETH/USD) gained ground early in today’s Asian session as the pair moved higher to the 295.93 area, again moving above the 100-bar MA (4-hourly) around the 294.29 level. The pair traded as low as the 278.65 area during yesterday’s North American session after Stops were elected below the 279.25 level, representing the 61.8% retracement of the move from 226.56 to 364.48. During its move lower yesterday, ETH/USD stopped short of testing the 200-bar MA (4-hourly), currently indicating around the 274.01 area.
Chartists are closely observing the pair’s immediate downside price targets including the 272.56 area, representing the 23.6% retracement of the move from 894.00 to 80.60. Below that level, the 263.60 area represents the 38.2% retracement of the move from 222.88 to 288.77, and the 257.22 area represents the 23.6% retracement of the move from 828.97 to 80.60. Technicians see various Bids between the 249 - 255 areas.
Price activity is nearest the 100-bar MA (4-hourly) at 294.27 and the 50-bar MA (Hourly) at 298.66.
Technical Support is expected around 272.56/ 249.90/ 226.56 with Stops expected below.
Technical Resistance is expected around 314.00/ 322.16/ 329.73 with Stops expected above.
On 4-Hourly chart, SlowK is Bullishly above SlowD while MACD is Bearishly below MACDAverage.
On 60-minute chart, SlowK is Bullishly above SlowD while MACD is Bullishly above MACDAverage.