Sally Ho's Technical Analysis 13 July 2019
Bitcoin
Bitcoin (BTC/USD) was slightly stronger early in today’s Asian session as the pair escalated higher to the 11,950.00 level, stopping just short of testing an important level around the 11,978.03 area, representing the 38.2% retracement of the 8,919.72 – 13,868.44 range. The next upside price level related to this range is the 12,700.54 area and the next downside price level related to this range is the 11,394.08 area. Early in today’s Asian session, the pair found some buying demand right around the 100-bar MA (4-hourly), currently indicating around the 11,612.88 area.
The price also continues to orbit the 50-bar MA (4-hourly), currently indicating around the 11,735.17 area. The 11,800.00 level has emerged as an important technical one, as it represents the 38.2% retracement of the move from 13,202.63 to 10,933.00. Late during yesterday’s Asian session, price activity went to this level and orbited during the European and North American sessions. The next two upside areas related to this range are 12,067.82 and 12,335.63. Chartists are also monitoring price activity around the 10,958.60 level, and the next downside price level related to its technical relevance is the 10,271.87 area.
Price activity is nearest the 50-bar MA (4-hourly) at 11,735.17 and the 50-bar MA (Hourly) at 11,601.65.
Technical Support is expected around 10,935.65/ 10,637.26/ 10,087.62 with Stops expected below.
Technical Resistance is expected around 12,063.68/ 12,498.91/ 12,930.57 with Stops expected above.
On 4-Hourly chart, SlowK is Bullishly above SlowD while MACD is Bearishly below MACDAverage.
On 60-minute chart, SlowK is Bearishly below SlowD while MACD is Bullishly above MACDAverage.
Ethereum
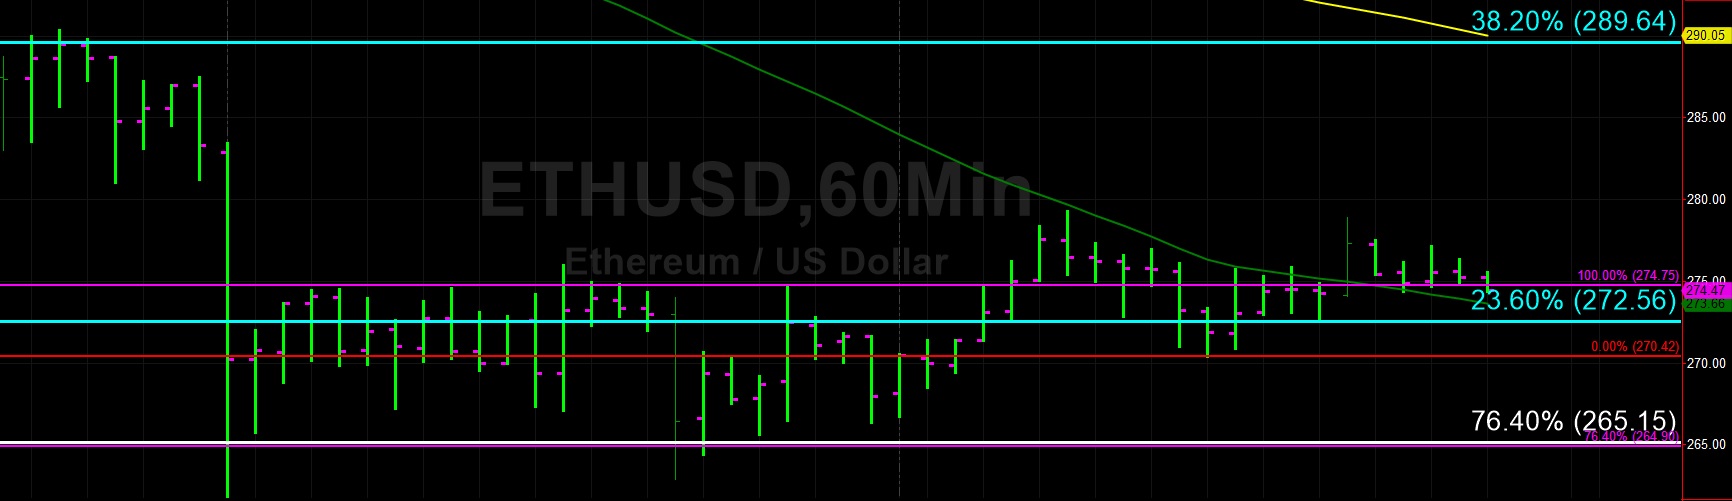
Ethereum (ETH/USD) drifted higher early in today’s Asian session as the pair traded as high as the 278.94 area after finding buying demand around the 270.92 level. Stops were elected below the 273.50 and 270.42 areas during Thursday’s European session, representing relative lows from 27 June and 2 July. Additional Stops were then elected below the 263.30 area during the further pullback lower. The 258.92 area remains a technically-significant level related to a long-term downward price range, and as market activity continues to approach this area, bearish sentiment is likely to increase.
ETH/USD has remained in a relatively tight range during the past two days. During yesterday’s European and North American sessions, price activity was toppish around the 279.25 area, representing the 61.8% retracement of the move from 226.56 to 364.49. The next upside retracement level related to this range is 295.52, and the next downside retracement area related to this range is 259.11. Technicians are also paying close attention to the 200-bar MA (4-hourly), currently indicating around the 286.24 area. Some chartists are anticipating a series of Bids between the 249 – 255 areas.
Price activity is nearest the 200-bar MA (4-hourly) at 286.24 and the 50-bar MA (Hourly) at 273.68.
Technical Support is expected around 267.11/ 253.53/ 249.90 with Stops expected below.
Technical Resistance is expected around 289.64/ 293.01/ 297.49 with Stops expected above.
On 4-Hourly chart, SlowK is Bullishly above SlowD while MACD is Bearishly below MACDAverage.
On 60-minute chart, SlowK is Bullishly above SlowD while MACD is Bullishly above MACDAverage.
