Sally Ho's Technical Analysis 11 July 2019
Bitcoin
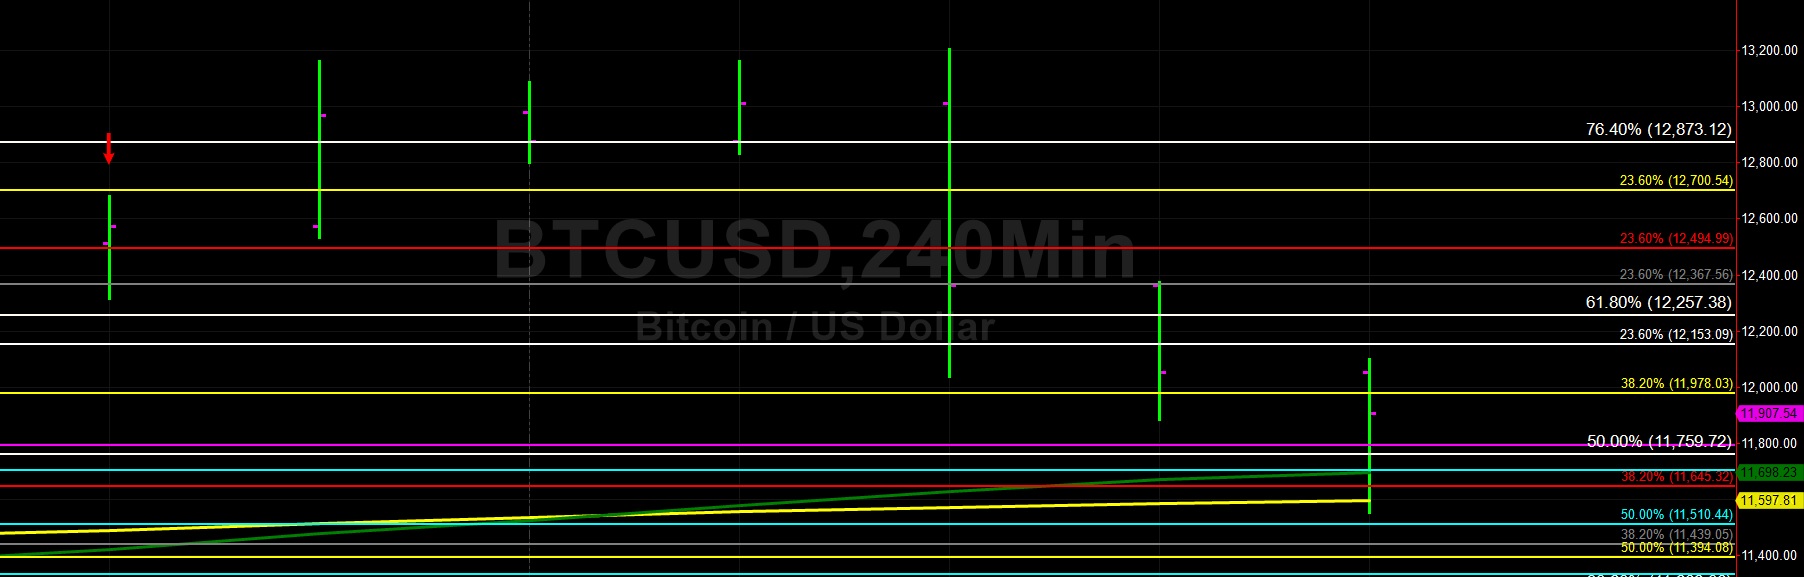
Bitcoin (BTC/USD) extended losses early in today’s Asian session as the pair tumbled to the 11,620.00 level after strong selling pressure commenced around the 13,202.63 area during yesterday’s North American session. Demand was relatively steady through yesterday’s Asian and European sessions and carried forth into the North American session before major selling pushed the pair back below the 12,873.12 level. During the sharp pullback lower, the 12,367.56 level emerged as an important one where selling pressure re-emerged during a brief retracement higher, and this area represents the 23.6% retracement of the move from 7507.77 to 13,868.44.
The next downside level related to this range is the 11,439.05 level, followed by the 10,688.61 area. Some Stops were triggered below the 50-bar MA (4-hourly) during the quick downward move, and demand finally emerged just above the 100-bar MA (4-hourly), currently indicating around the 11,596.43 level. Chartists identified the 12,059 area as a key intraday downside price extension objective, and the market twice tested that level before moving decisively below it during yesterday’s North American session. Downside targets include the 11,360/ 10,924/ 10,221 areas.
Price activity is nearest the 50-bar MA (4-hourly) at 11,694.87 and the 100-bar MA (Hourly) at 11,687.52.
Technical Support is expected around 11,234.03/ 10,935.65/ 10,637.26 with Stops expected below.
Technical Resistance is expected around 12,063.68/ 12,498.91/ 12,930.57 with Stops expected above.
On 4-Hourly chart, SlowK is Bearishly below SlowD while MACD is Bearishly below MACDAverage.
On 60-minute chart, SlowK is Bearishly below SlowD while MACD is Bearishly below MACDAverage.
Ethereum
Ethereum (ETH/USD) continued its weakness early in today’s Asian session as the pair traded as low as the 283.00 figure after being capped around the 288.78 level. Massive selling pressure dominated yesterday’s North American session as traders pushed the pair sharply lower from the 311.07 area. During yesterday’s Asian session, the pair traded as high as the 314.98 level, just below the 23.6% retracement of the move from 157.28 to 364.49. The next downside price target related to that range is the 285.34 level.
ETH/USD briefly rebounded during yesterday’s North American session and moved higher to the 291.13 area, just below the 38.2% retracement of the 324.50 – 271.12 range. The pair briefly traded below the 200-bar MA (4-hourly) during the descent after yesterday’s low of 281.30 area was established. Notably, this level is right around the 38.2% retracement of the 146.00 – 364.49 range. The next downside level related to this range is the 255.25 area. Technicians see the 275/ 267/ 253 areas as possible downside price extension objectives.
Price activity is nearest the 200-bar MA (4-hourly) at 284.36 and the 200-bar MA (Hourly) at 297.88.
Technical Support is expected around 272.56/ 267.11/ 253.53 with Stops expected below.
Technical Resistance is expected around 297.49/ 311.07/ 318.60 with Stops expected above.
On 4-Hourly chart, SlowK is Bearishly below SlowD while MACD is Bearishly below MACDAverage.
On 60-minute chart, SlowK is Bullishly above SlowD while MACD is Bearishly below MACDAverage.
