Bitcoin
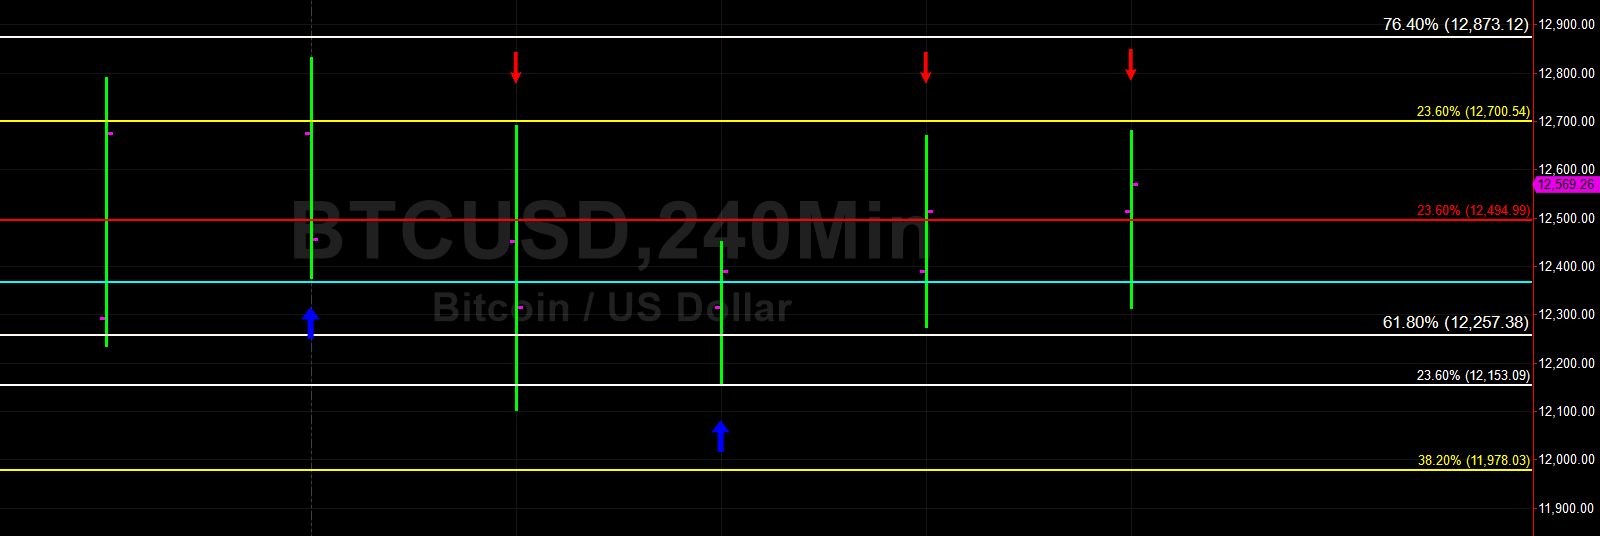
Bitcoin (BTC/USD) extended recent gains early in today’s Asian session with the pair trading as high as the 12,680.00 level following some buying activity that was reignited during yesterday’s European session around the 12,105.32 area. Demand intensified late in yesterday’s Asian session heading into yesterday’s European session and the pair traded as high as the 12,829.96 area, just below a retracement area that represents the 76.4% retracement of the recent move from 13,868.44 to 9,651.00. The next relevant level related to that range below current market activity is the 12,257.38 area.
Early in today’s Asian session, the pair was poised to approach and test the 12,700.54 level, another important area that was toppish late in yesterday’s European and North American sessions, and one that represents the 23.6% retracement of the 8,919.72 – 13,868.44 range. The next downside retracement level related to this range is the 11,978.03 area. If BTC/USD maintains its current upward bias and moves above the 12,873.12 area, the 13,488.49 level remains the 61.8% retracement of the move from 19,891.99 to 3,128.89.
Price activity is nearest the 100-bar MA (4-hourly) at 11,491.40 and the 50-bar MA (Hourly) at 12,099.40.
Technical Support is expected around 11,759.72/ 11,091.90/ 10,810.13 with Stops expected below.
Technical Resistance is expected around 12,873.12/ 13,488.49/ 13,868.44 with Stops expected above.
On 4-Hourly chart, SlowK is Bullishly above SlowD while MACD is Bullishly above MACDAverage.
On 60-minute chart, SlowK is Bearishly below SlowD while MACD is Bearishly below MACDAverage.
Ethereum
Ethereum (ETH/USD) started to recover from consistent selling pressure that paused early in today’s Asian session as the pair dropped to the 302.78 area before moving back to the 307.35 area. Selling pressure started in earnest during yesterday’s Asian session as soon as the pair peaked around the 318.60 level, representing the 50% retracement of the move from 365.15 to 270.42. The next downside price level related to tha
t range is the 306.99 area, and Stops were elected below this level during yesterday’s North American session during the pair’s descent.
ETH/USD currently has bearish short-term sentiment, and the next downward price level related to the aforementioned range is the 293.01 area. Some Bids emerged early in today’s Asian session right around the 100-bar MA (4-hourly), currently indicating around the 302.77 area. There are multiple retracement areas between the 285 – 289 areas and these represent potential technical Support. Chartists anticipate stronger technical Support around the 272.56 area, a key level that represents the 23.6% retracement of the 894.00 – 80.60 range.
Price activity is nearest the 100-bar MA (4-hourly) at 302.77 and the 50-bar MA (Hourly) at 309.70.
Technical Support is expected around 298.24/ 289.64/ 272.56 with Stops expected below.
Technical Resistance is expected around 322.16/ 328.56/ 342.29 with Stops expected above.
On 4-Hourly chart, SlowK is Bearishly below SlowD while MACD is Bearishly below MACDAverage.
On 60-minute chart, SlowK is Bullishly above SlowD while MACD is Bearishly below MACDAverage.