Sally Ho's Technical Analysis 30 June 2019
Bitcoin
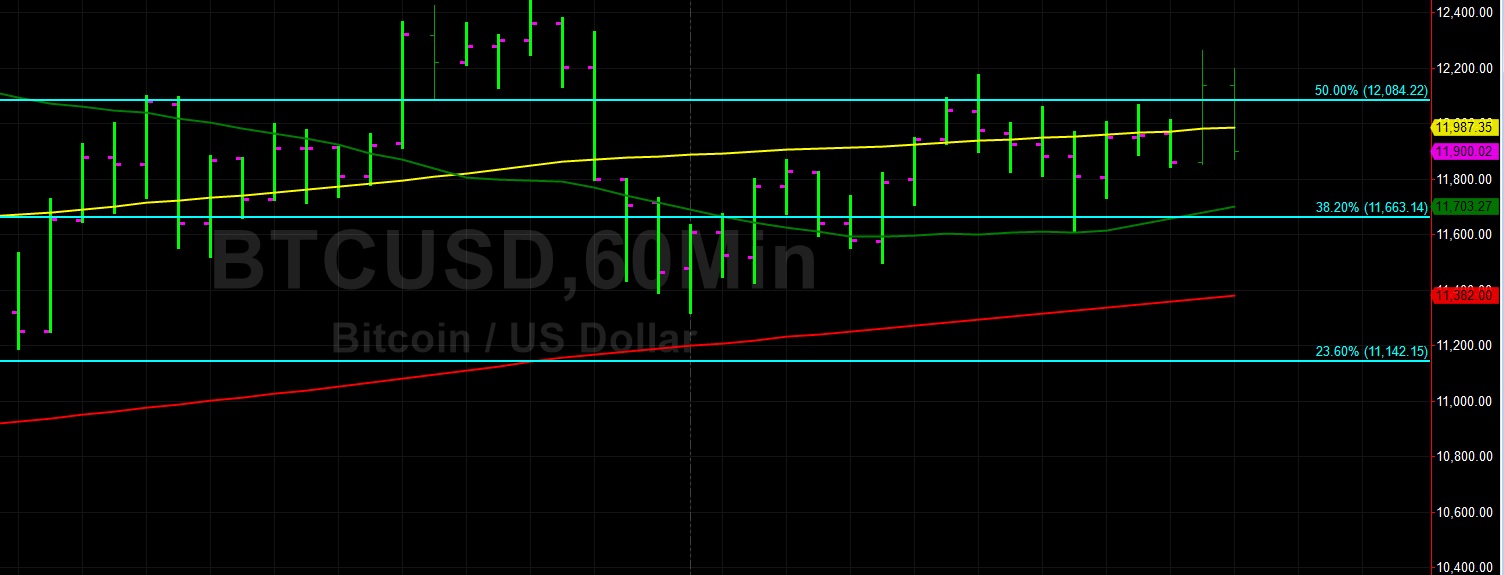
Bitcoin (BTC/USD) gained ground early in today’s Asian session as traders pushed the pair to the 12,262.92 level, its strongest showing since the sell-off that started during yesterday’s Asian session around the 12,444.77 level. Stops were elected above the 12,153.09 area early in yesterday’s North American session, representing the 23.6% retracement of the move from 6,600 to 13,868.44. Early in yesterday’s European session, traders pushed the pair lower and tested Bids around the 11,318.94 level, just above the 50-bar MA (4-hourly).
Above current market activity, the 12,494.99 area is an upside price objective, representing the 23.6% retracement of the move from 8048.75 to 13,868.44. Likewise, the 12,700.54 area is the 23.6% retracement of the 8919.72 – 13,868.44 range and the 13,026.29 level is another upside price target and represents the 76.4% retracement of the move from 13,868.44 – 10,300.00. Below current market activity, the 11,091.90 and 10,688.61 areas represent downside retracement levels and areas of potential technical Support.
Price activity is nearest the 50-bar MA (4-hourly) at 11,449.37 and the 100-bar MA (Hourly) at 11,990.00.
Technical Support is expected around 10,234.22/ 10,087.62/ 9765.93 with Stops expected below.
Technical Resistance is expected around 12,700.54/ 13,026.29/ 13,488.49 with Stops expected above.
On 4-Hourly chart, SlowK is Bullishly above SlowD while MACD is Bearishly below MACDAverage.
On 60-minute chart, SlowK is Bullishly above SlowD while MACD is Bullishly above MACDAverage.
Ethereum
Ethereum (ETH/USD) appreciated early in today’s Asian session as traders pushed the pair to the 314.67 area, its strongest print in two days, after it moved back above the 50-bar MA (4-hourly). The 314.00 figure represents the 50% retracement of the move from 547.40 to 80.60. Bids emerged early in yesterday’s European session around the 291.25 area and ETH/USD steadily moved higher. Also, the 312.75 level represents the 50% retracement of the move from 261.00 to 364.49.
Chartists are considering upside price targets for ETH/USD including 319.00/ 329.73/ 343.02. Stronger technical Resistance is likely around the 324.96 and 340.07 levels, important retracement areas related to the move higher from 261.00 to 366.48. Likewise, the 331.93 area represents the 23.6% retracement of the move from 226.56 to 364.48. Below current market activity, technical Support is possible around the 281 – 285 areas, and Bids are seen around the 293 – 294 levels.
Price activity is nearest the 50-bar MA (4-hourly) at 310.89 and the 200-bar MA (Hourly) at 310.25.
Technical Support is expected around 272.56/ 249.90/ 226.56 with Stops expected below.
Technical Resistance is expected around 329.73/ 343.02/ 364.49 with Stops expected above.
On 4-Hourly chart, SlowK is Bullishly above SlowD while MACD is Bullishly above MACDAverage.
On 60-minute chart, SlowK is Bearishly below SlowD while MACD is Bullishly above MACDAverage.
