Published
4 years ago on
June 03, 2019
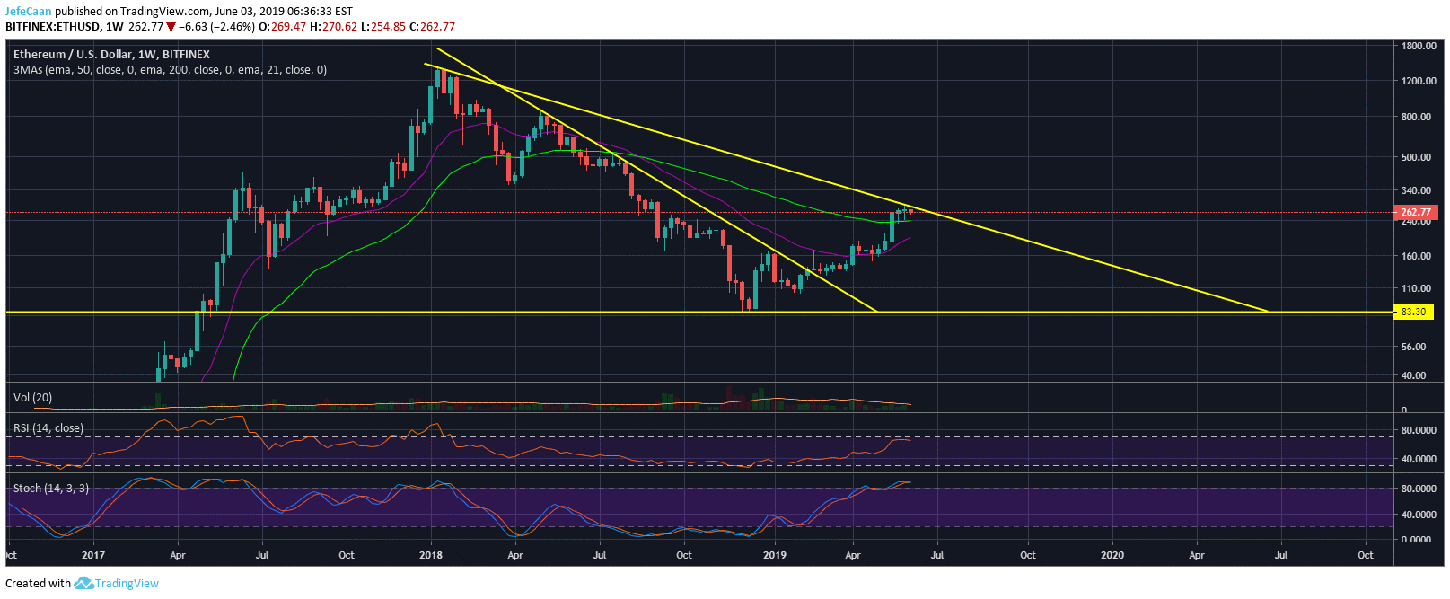
Ethereum (ETH) bears have regained control as the price has demonstrated serious weakness to break past the trend line resistance. The weekly chart for ETH/USD shows that both the RSI and Stochastic indicators are now flashing big warning signals as the price has reached overbought levels. The only thing holding the price from a massive decline at the moment is the 50 week exponential moving average. Soon as the price declines below this level, we could see it drop to double digits in no time. Short term, we could see ETH/USD attempt a break out of the descending triangle but it will most likely close inside it leaving a big wick to the upside. Even those that do not believe cryptocurrencies are due for further downside might be better off investing in Bitcoin (BTC) over Ethereum (ETH) at the moment because it risks a major correction against Bitcoin (BTC) in the weeks ahead.
We have been referring to the inevitable in most of our analyses on ETH/USD for the past few weeks. This is because the price is heavily overbought and it has to decline sharply sooner or later. Most retail bulls do not like it when someone talks about the possibility of a decline, but we need to realize that even if ETH/USD were to have bottomed and we were in an uptrend, the price still has to retrace to maintain its uptrend. There is no way for Ethereum (ETH) to keep on surging in this manner because every parabolic move like this is followed by a correction of some sort. This correction could happen tomorrow or it may take weeks but we have outlined that possibility on the weekly chart and it has to happen at some point. Nobody but insiders in this market can time the market to predict what exactly is going to happen at a certain point. For us, it all comes down to probabilities and possibilities.
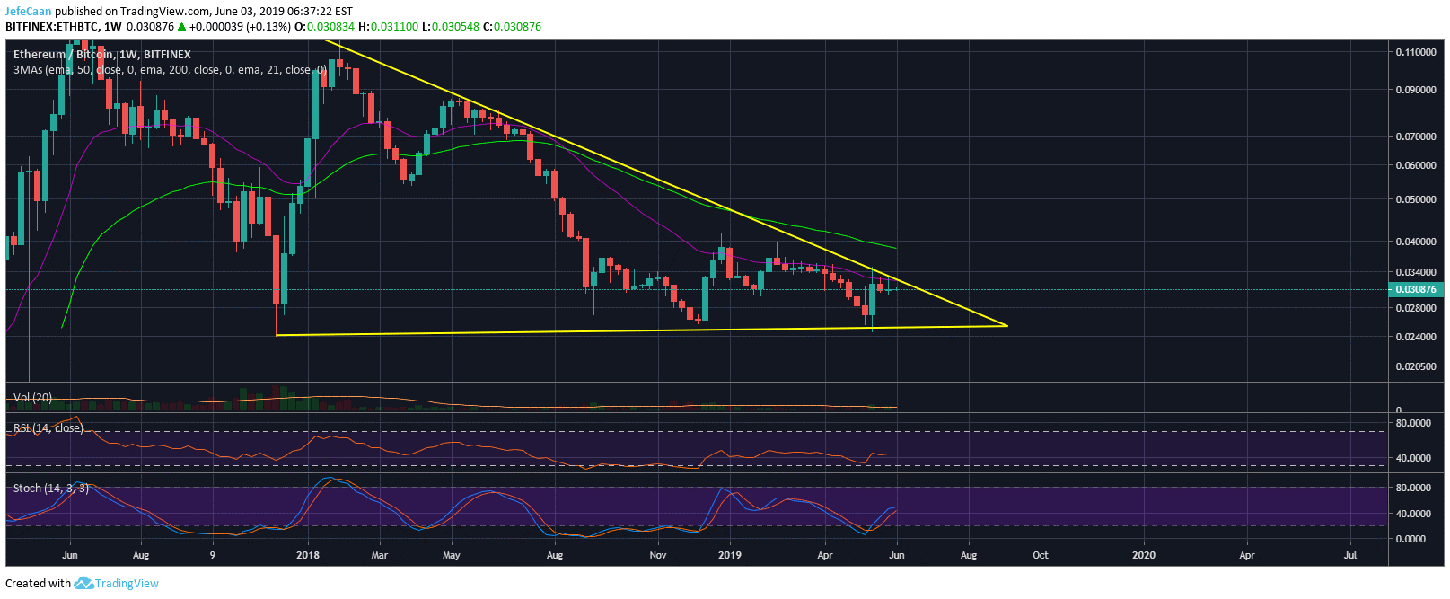
The weekly chart for ETH/BTC points to an even gloomier outlook for Ethereum (ETH) with regards to Bitcoin (BTC). This is because the price is trading with a large descending triangle that has not been breached so far. The price has tested the trend line resistance at multiple points but it has yet to break past it. This time, the price has also declined below the 21 week exponential moving average and is all set to decline towards the bottom of this triangle.
The bottom of this triangle has already been tested thrice before. If the price falls to test it again, we are likely to see a sharp move to the downside as ETH/BTC breaks below this triangle. That would be the time when the market inflicts maximum pain on Ethereum (ETH) and the rest of the altcoin market. We are likely to see some ICO projects get completely wiped off the market. As for Ethereum (ETH), this strong support will turn into a strong resistance and the price will have a hard time breaching it during the next bullish cycle.