Bitcoin (BTC) Might Still Shoot Above $12,500 Before Beginning Its Downtrend
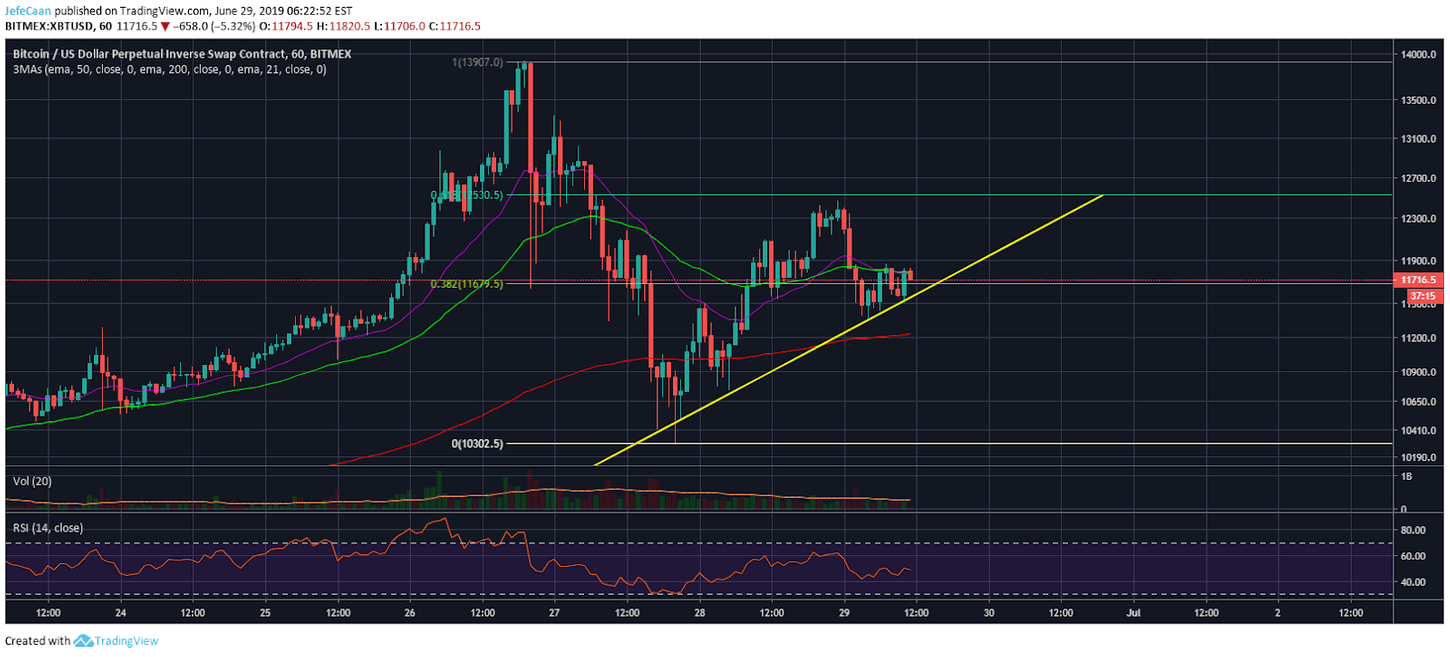
Bitcoin (BTC) still has plenty of room to rally now that it has cooled off after the recent crash. The 1H chart for BTC/USD shows that the price has found strong support atop the 38.2% fib retracement level. Furthermore, it is trading in an ascending triangle which could also break to the upside pushing Bitcoin (BTC) towards $12,500 or even higher levels before it tops out. It has become very tempting to go short on Bitcoin (BTC) after the recent crash. Big moves to the downside like the one we saw recently have a strong way of changing hearts and minds. Retail bears that were afraid to get in front of this rally are once again getting comfortable in doing so. Needless to say, most of them will meet the same fate as those that tried to get in front of this rally since $6,000 did.
This is a bullish development for now and the bulls are trying to push for control but it is important to realize that it is extremely risky to go long on Bitcoin (BTC) at this point because the cat is out of the bag and most professional traders now understand perfectly well what is going on. The price could shoot up to test the 61.8% fib retracement level and end up trading slightly higher than that before it tops out, but this is not the time to be buying Bitcoin (BTC). We saw just recently how the price tanked more than 20% in a single day. That could happen over and over again once the downtrend begins. When that happens, it might be too late to get out of your positions. Now, this is a warning to those that are trying to get in at this point. However, those that have long positions already opened with proper risk management; it may be a good idea to stick to those positions for a while.
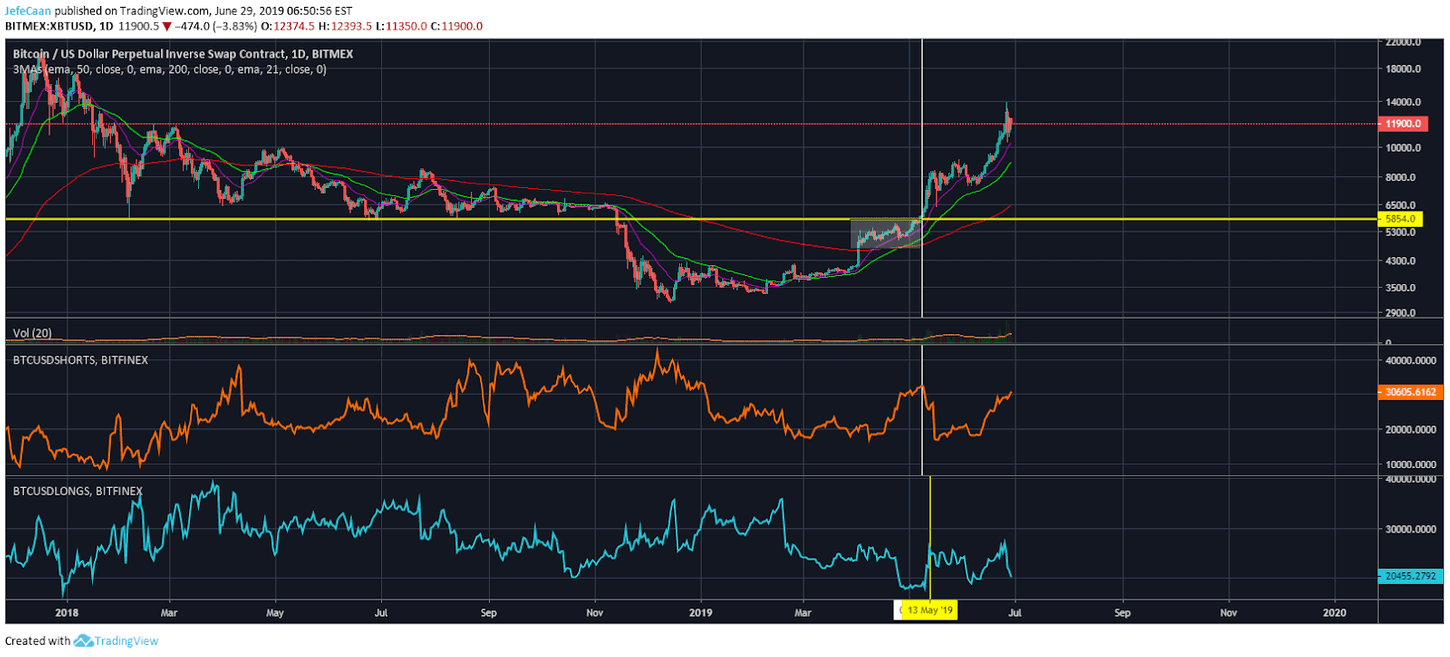
If we take a look at the daily chart for XBT/USD showing BTCUSDShorts and BTCUSDLongs, we can see a few important things. When the price closed above the 200 Day EMA and started to consolidate, most retail traders thought this move was a fake out. This was a reasonable to expect because the price had just broken above a bear pennant. However, technical analysis is not just about charts and lines and patterns on the chart; it is about the meaning and the intent behind those lines and patterns. If we look at the daily chart for XBT/USD, we can see the price started to consolidate just above $6,000. Now, if we take a look at BTCUSDShorts and BTCUSDLongs, we can see that at this point, most retail traders started to be overly bearish. BTCUSDShorts shot up whereas BTCUSDLongs started to decline because the bulls didn’t expect the price to rally.

Now, if we look at this chart, what was the play for market makers here? The play was to hunt the bear because the bull was already down and not putting up a fight. So, they did that and the price started to shoot up after May 13 contrary to the expectations of both the bears and the bulls. Now, the same thing is happening again. BTCUSDShorts is going up and BTCUSDLongs is coming down. The bulls are out of the fight and the bears still remain a challenge for the market makers. The best way to get rid of them would be to print some long wicks to the upside to wipe them out. This is why we expect the price could still rise above $12,500 near term. That does not mean though that it is going to begin a new bull trend because the bear market is not over yet.