Bitcoin
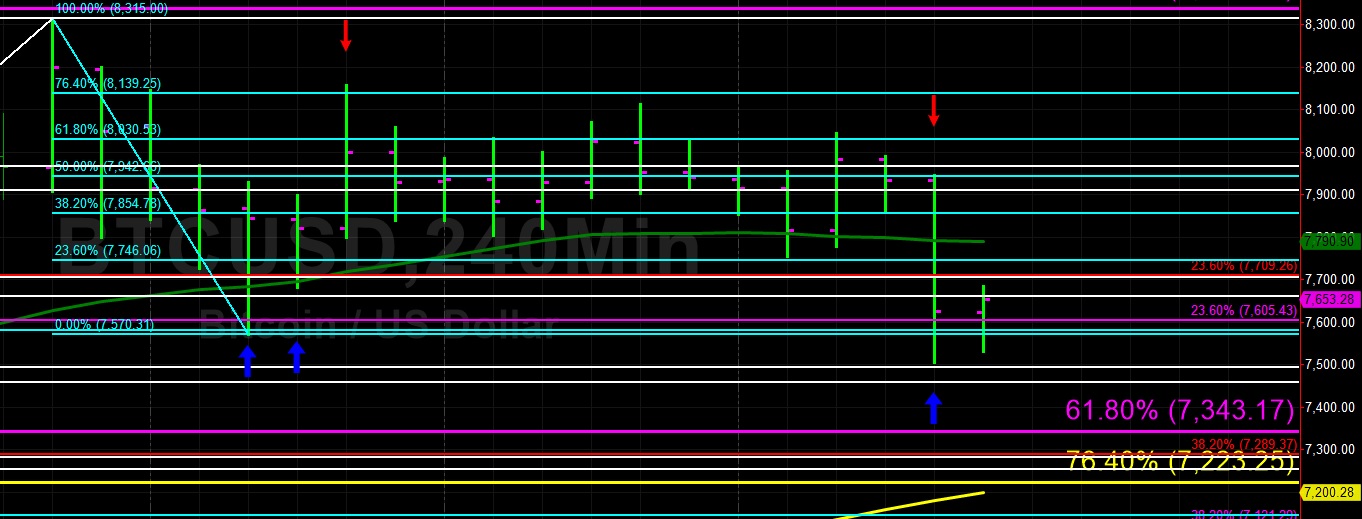
Bitcoin (BTC/USD) depreciated sharply early in today’s Asian session, trading as low as the 7506.12 level following selling pressure that commenced during yesterday’s European session and continued through yesterday’s North American session. Today’s intraday low is just above the 50% retracement of the move from 8388.00 to 6600.00. Stops were elected below the 50-bar MA (4-hourly) at 7793.43 during the move lower, with additional Stops reached below the 7605.43 area during the descent, representing the 23.6% retracement of the 5072.01 – 8388.00 range.
Given the pullback, traders are evaluating areas of possible technical Support on the downside. Below the 7494.00 figure, the 7343.17 area represents the 61.8% retracement of the move from 9948.12 to 3128.89. The 7289.37 and 7223.25 levels also represent important areas of technical Support, and then the 100-bar MA (4-hourly) is around 7200.17 at present. Traders are also paying attention to the 7457.50 area, representing the 50% retracement of the recent move from 6600.00 to 8315.00. Technicians note that BTC/USD is now trading below the 50-bar MA (hourly), 100-bar MA (hourly), and 200-bar MA (hourly).
Price activity is nearest the 50-bar MA (4-hourly) at 7790.67 and the 200-bar MA (Hourly) at 7786.80.
Technical Support is expected around 7457.50/ 7256.13/ 6830.99 with Stops expected below.
Technical Resistance is expected around 8006.01/ 8488.00/ 8678.17 with Stops expected above.
On 4-Hourly chart, SlowK is Bearishly below SlowD while MACD is Bearishly below MACDAverage.
On 60-minute chart, SlowK is Bullishly above SlowD while MACD is Bearishly below MACDAverage.

Ethereum
Ethereum (ETH/USD) came off early in today’s Asian session as the pair tested Bids around the 240.04 area after encountering selling pressure during yesterday’s European and North American sessions that began in yesterday’s Asian session after traders started pushing the pair lower from the 264.20 area. Some chunky Stops were triggered below the 248.84 area during the move lower today, representing the 38.2% retracement of the move from 264.77 to 239.00. Stops were also triggered nearby below the 246.87 level, representing the 50-bar MA (4-hourly).
Stops were also elected today below the 243.83 area, representing the 50.0% retracement of the move from 222.88 to 264.77. Traders are now identifying areas of potential technical Support below current price activity. The 238.99 level represents the 61.8% retracement of the aforementioned 222.88 – 264.77 range and the 236.78 area represents the 23.6% retracement of the 281.77 – 222.88 range.
Price activity is nearest the 50-bar MA (4-hourly) at 247.63 and the 200-bar MA (Hourly) at 247.01.
Technical Support is expected around 236.78/ 219.53/ 204.84 with Stops expected below.
Technical Resistance is expected around 259.27/ 272.56/ 281.77 with Stops expected above.
On 4-Hourly chart, SlowK is Bearishly below SlowD while MACD is Bearishly below MACDAverage.
On 60-minute chart, SlowK is Bullishly above SlowD while MACD is Bearishly below MACDAverage.