Published
4 years ago on
May 13, 2019
Bitcoin
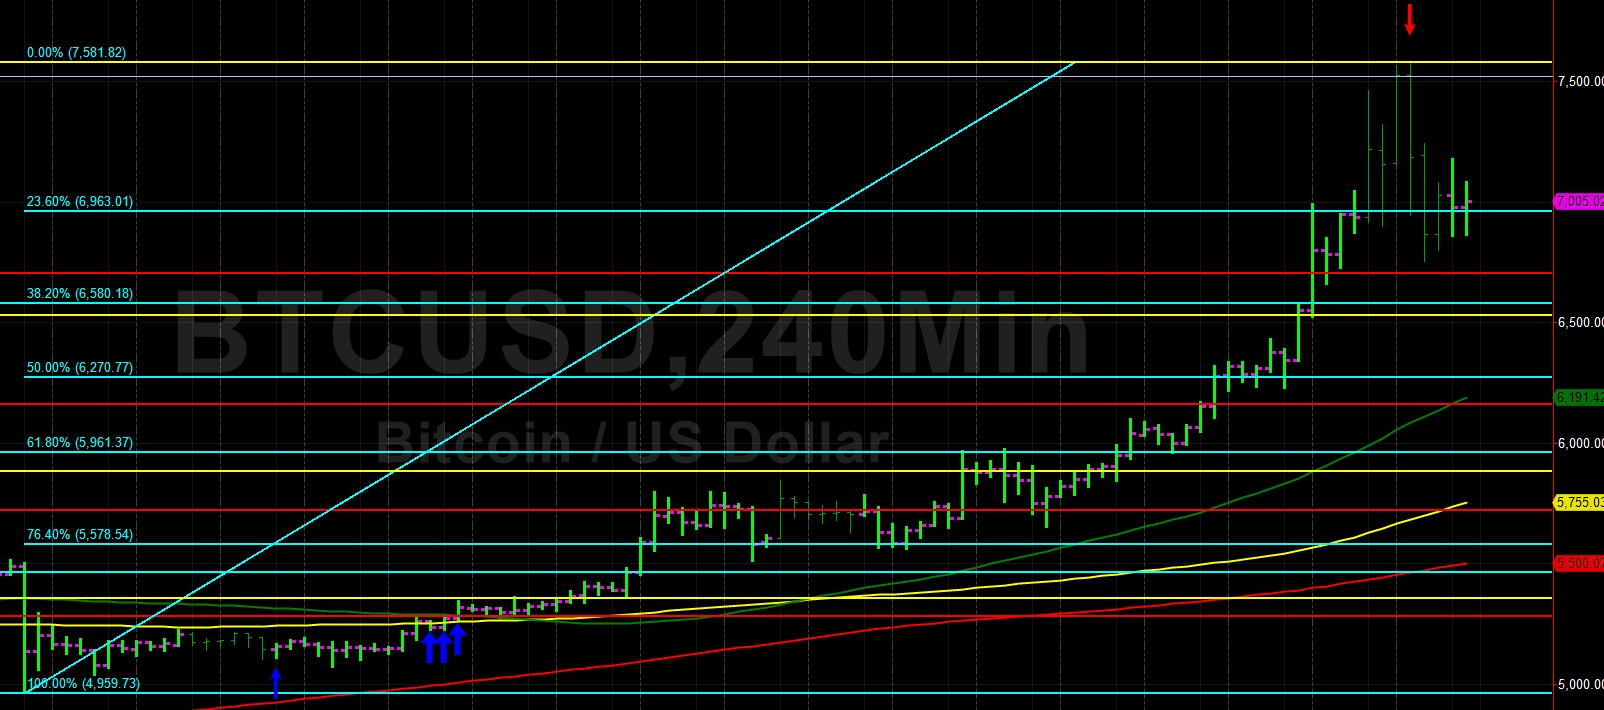
Bitcoin (BTC/USD) settled down after this weekend’s major thrust higher to levels not seen since August 2018. After trading as high as 7581.82 during yesterday’s European session, the pair receded to the 6755.00 area during yesterday’s North American session and then traded as high as the 7178.79 area before coming off early in today’s Asian session. The pair has been hovering around the 50-bar MA (hourly) for the last several hours.
The pair has also orbited the 6963.01 level during the last several hours, representing the 23.6% retracement of the move from 4959.73 to 7581.82. Notably, the pair was toppish around the 7084 area during a move higher, just below the 23.6% retracement of the move from 5512.00 to 7581.82. The pair’s run higher has established new areas of technical Support with the 6791.15/ 6583.19/ 6274.72 areas now being watched by chartists.
Price activity is nearest the 50-bar MA (4-hourly) at 6191.78 and the 50-bar MA (Hourly) at 6997.44.
Technical Support is expected around 6623.07/ 6440.82/ 6213.35 with Stops expected below.
Technical Resistance is expected around 7581.82/ 8338.78/ 8488.00 with Stops expected above.
On 4-Hourly chart, SlowK is Bullishly above SlowD while MACD is Bearishly below MACDAverage.
On 60-minute chart, SlowK is Bullishly above SlowD while MACD is Bearishly below MACDAverage.
Ethereum
Ethereum (ETH/USD) gained a little bit of ground early in today’s Asian session as the pair traded as high as the 191.22 area, right around the 50% retracement of the move from 302.20 to 80.60. During yesterday’s North American session, the pair reached a low around the 177.24 level after Stops were elected below the 182.14 area, representing the 50% retracement of the move from 157.28 to 207.00. Following the pair’s move lower from its recent 2019 high, new upside technical Resistance levels have been established including 197.60 and 201.19.
Below current price activity, chartists are eyeing technical Support levels including the 183.33 area, representing the 23.6% retracement of the move from 515.88 to 80.60, and the 172.88 level, representing the 38.2% retracement of the 322.16 – 80.60 range. Stops may also be in place below the 182.14 area and if elected, they could accelerate a move lower toward the 177.80 level.
Price activity is nearest the 50-bar MA (4-hourly) at 173.59 and the 50-bar MA (Hourly) at 189.59.
Technical Support is expected around the 181.20/ 175.10/ 168.47 levels with Stops expected below.
Technical Resistance is expected around the 197.60/ 201.38/ 214.08 levels with Stops expected above.
On 4-Hourly chart, SlowK is Bullishly above SlowD while MACD is Bearishly below MACDAverage.
On 60-minute chart, SlowK is Bullishly above SlowD while MACD is Bearishly below MACDAverage.
Investment Disclaimer