Sally Ho's Technical Analysis 12 May 2019
Bitcoin
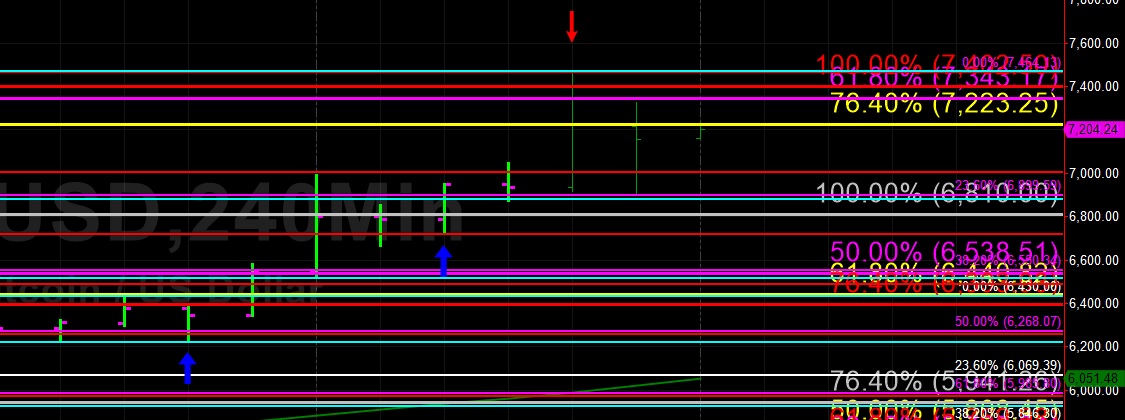
Bitcoin (BTC/USD) exploded higher late in yesterday’s North American session and traded as high as the 7464.13 area before some profit-taking ensued early in today’s Asian session, pushing the pair back to the 6900.00 figure. As we predicted in recent analyses, chunky Stops were elected above the 7343.17 area, representing the 61.8% retracement of the move from 9948.12 – 3128.89. Major Stops were also elected above the 7223.25 level during the move higher, representing the 76.4% retracement of the move from 8488.00 to 3128.89.
Stops were also triggered above the 7402.50 area, a relative high dating to 4 September 2018, and yesterday’s high represents the pair’s strongest showing since 4 August 2018. The move higher has resulted in new areas of technical Support during pullbacks lower. The 6899.59 level represents the 23.6% retracement of the move from 5072.01 to 7464.13 and the 6538.51 level represents the 50% retracement of the move from 9948.12 to 3128.89.
Price activity is nearest the 50-bar MA (4-hourly) at 6019.73 and the 50-bar MA (Hourly) at 6578.77.
Technical Support is expected around 6538.51/ 6213.35/ 5941.26 with Stops expected below.
Technical Resistance is expected around 8338.78/ 8488.00/ 9948.12 with Stops expected above.
On 4-Hourly chart, SlowK is Bearishly below SlowD while MACD is Bullishly above MACDAverage.
On 60-minute chart, SlowK is Bearishly below SlowD while MACD is Bullishly above MACDAverage.
Ethereum
Ethereum (ETH/USD) found a Bid early in today’s Asian session after trading as high as the 207.00 figure late in yesterday’s North American session, its strongest print since mid-November 2018. Chunky Stops were reached above the 189.23 level during the move higher, representing the 76.4% retracement of the move from 222.78 to 80.60, following the execution of Stops above the 177.80 area.
Chartists are now identifying levels of technical Support on retracements lower. The 184.77 area represents the 38.2% retracement of the move from 148.81 to 207.00 and the 181.46 level represents the 50% retracement of the 155.91 – 207.00 range. Also, the 177.80 area is the 76.4% retracement of the 148.81 to 207.00 range and the 176.50 area is the 50% retracement of the move from 155.91 to 207.00.
Price activity is nearest the 50-bar MA (4-hourly) at 170.84 and the 50-bar MA (Hourly) at 181.56.
Technical Support is expected around the 186.13/ 181.20/ 175.10 levels with Stops expected below.
Technical Resistance is expected around the 214.08/ 219.32/ 224.97 levels with Stops expected above.
On 4-Hourly chart, SlowK is Bearishly below SlowD while MACD is Bullishly above MACDAverage.
On 60-minute chart, SlowK is Bullishly above SlowD while MACD is Bearishly below MACDAverage.
