Bitcoin
Bitcoin (BTC/USD) appreciated sharply during today’s Asian session as the pair traded as high as the 5846.88 level, its strongest print since 14 November 2018. During yesterday’s European and North American sessions, the 5650.01 area was supportive, representing a previous relative high from 23 April 2019, and Stops were triggered yesterday once the market moved below this area. Stops were also elected below the 5593.97 area, representing the 38.2% retracement of the 5265.61 – 5796.93 area, with additional Stops reached below the 5531.27 area.
An upside target that was have talked extensively about was reached during the ascent higher as the 5808.45 area gave way early in today’s Asian session, with the ensuing Stops pushing the pair to multi-month highs. Chartists are eyeing the 5941.26 as the next major upside target, representing the 76.4% retracement of the 6810.00 – 3128.89 range.
Price activity is nearest the 100-bar MA (4-hourly) at 5344.18 and the 50-bar MA (Hourly) at 5654.84.
Technical Support is expected around 5468.57/ 5234.73/ 5125.13 with Stops expected below.
Technical Resistance is expected around 5941.26/ 6393.93/ 6440.82 with Stops expected above.
On 4-Hourly chart, SlowK is Bullishly above SlowD while MACD is Bullishly above MACDAverage.
On 60-minute chart, SlowK is Bearishly below SlowD while MACD is Bullishly above MACDAverage.
Ethereum
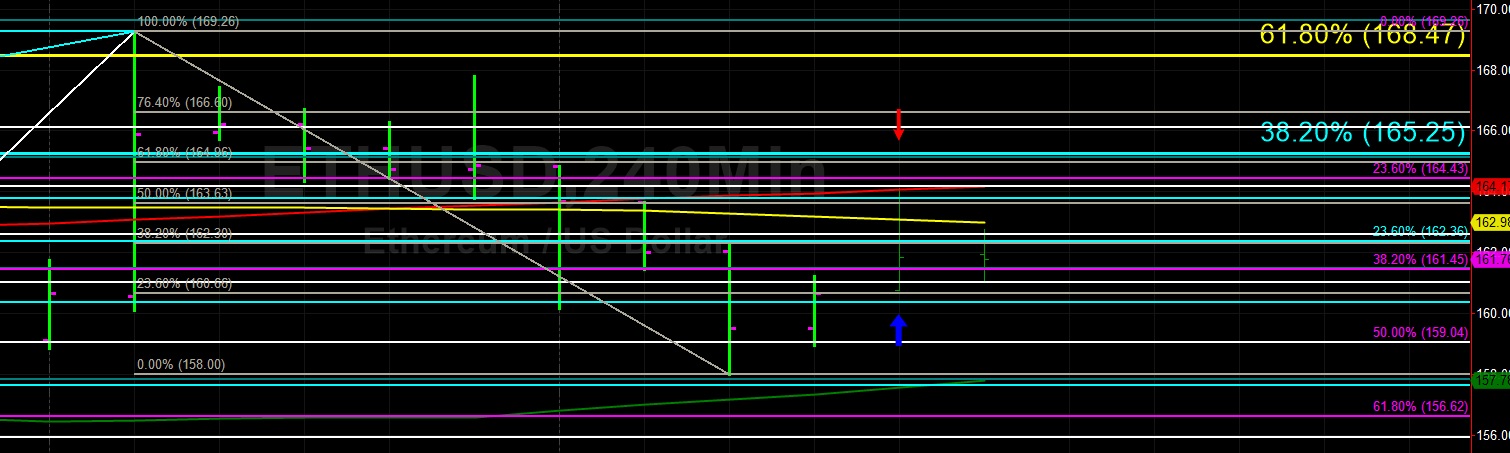
Ethereum (ETH/USD) continued its drive higher during today’s Asian session with the pair reaching the 164.10 level following its push lower to the 158.00 figure during yesterday’s North American session. The pair continues to orbit the 100-bar MA (4-hourly), having moved below it during yesterday’s European session and back above it early in today’s Asian session.
Notably, today’s intraday high was right around the 38.2% retracement of the 155.91 – 169.26 area. Technicians are looking to see if the price can remain above the 157.82 area, representing the 38.2% retracement of the 176.94 – 146.00 range. Around the area, the 50% retracement of the move from 146.00 to 169.26 could be supportive, with Stops expected below.
Price activity is nearest the 100-bar MA (4-hourly) at 162.98 and the 100-bar MA (Hourly) at 160.88.
Technical Support is expected around the 154.89/ 151.49/ 146.00 levels with Stops expected below.
Technical Resistance is expected around the 169.26/ 172.88/ 183.33 levels with Stops expected above.
On 4-Hourly chart, SlowK is Bullishly above SlowD while MACD is Bearishly below MACDAverage.
On 60-minute chart, SlowK is Bearishly below SlowD while MACD is Bullishly above MACDAverage.
Litecoin
Litecoin (LTC/USD) consolidated some gains during today’s Asian session as the pair moved higher to test the 200-bar MA (4-hourly), then around 77.81 early in the Asian session, before yielding some gains. Short-term selling pressure became evident after the pair moved lower from the 77.25 area during a pullback in the Asian session, representing the 50% retracement of the 80.99 – 73.50 range. Some shorts were covered around the 76.36 level, representing the 38.2% retracement of the same range, but additional Stops were reached below.
Chartists are eyeing the 75.27 area as an additional short-term downside target, representing the 23.6% retracement of the aforementioned range. Chartists are also interested to see if the 100-bar MA (4-hourly) will provide technical Support, currently indicating around the 74.52 area.
Price activity is nearest the 200-bar MA (4-hourly) at 77.89 and the 50-bar MA (Hourly) at 76.40.
Technical Support is expected around the 70.56/ 67.23/ 64.36 levels with Stops expected below.
Technical Resistance is expected around the 81.55/ 83.97/ 86.51 levels with Stops expected above.
On 4-Hourly chart, SlowK is Bullishly above SlowD while MACD is Bearishly below MACDAverage.
On 60-minute chart, SlowK is Bearishly below SlowD while MACD is Bullishly above MACDAverage.
Bitcoin Cash
BCH/USD (Bitcoin Cash/ US dollar) moderated early in today’s Asian session after testing Offers around the 294.55 level, eventually trading as low as the 283.70 level, right around the 38.2% retracement of the 309.00 – 267.75 range. Stops were elected late in yesterday’s North American session above the 293.24 area, representing the 61.8% retracement of the 309.00 – 267.75 range.
If additional selling pressure emerges, chartists are eyeing the 265.55 area as possible technical Support, representing the 23.6% retracement of the 888.19 – 73.22 range. If additional buying pressure emerges, chartists are eyeing upside levels including 314.12 and 330.57 as upside targets. The 341.50 area is another important upside target, representing the 23.6% retracement of the 1209.99 – 73.22 range.
Price activity is nearest the 200-bar MA (4-hourly) at 278.62 and the 50-bar MA (Hourly) at 282.71.
Technical Support is expected around the 265.55/ 240.89/ 227.40 levels with Stops below.
Technical Resistance is expected around the 309.00/ 314.12/ 335.00 levels with Stops above.
On 4-Hourly chart, SlowK is Bullishly above SlowD while MACD is Bearishly below MACDAverage.
On 60-minute chart, SlowK is Bearishly below SlowD while MACD is Bullishly above MACDAverage.