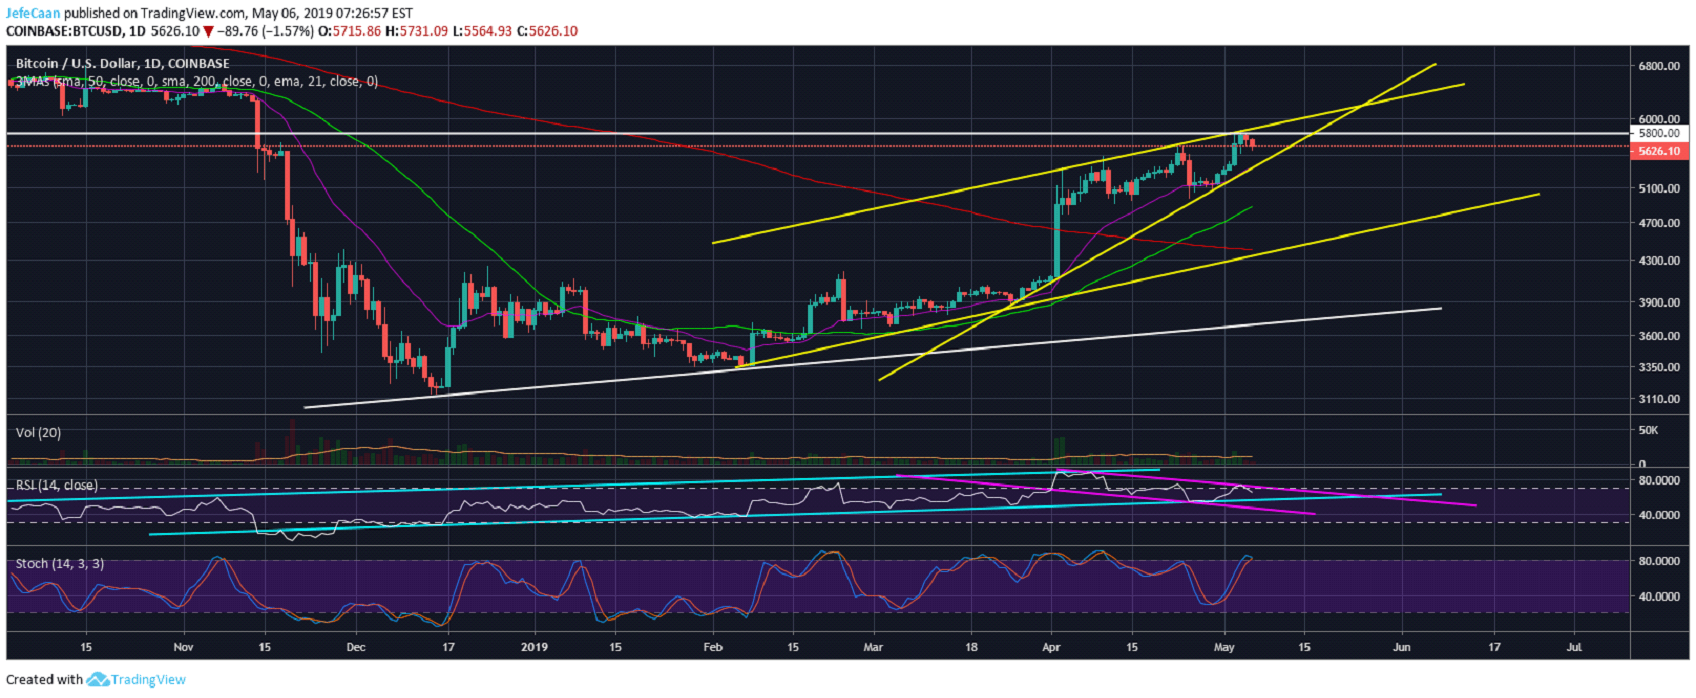
Bitcoin (BTC) has retraced strongly below the $5,800 level and is currently trading just above $5,600. This move comes after BTC/USD took a swing to the downside when it ran into a confluence of resistances. The price faced a strong rejection at a trend line resistance and the $5,800 resistance level and it decline aggressively. RSI on the daily chart shows the bearish divergence. Stochastic indicator also points to the likelihood of a major move to the downside. It is pertinent to note that BTC/USD is trading within a large rising wedge that could break to the downside anytime now. There are still a lot of people expecting it to break to the upside such that BTC/USD would shoot straight to $8,000. We still don’t think it is probable and that most such speculators are in for a big surprise.
There is no shortage of opportunities when it comes to trading. The trader that always ends up losing money is a desperate trader. A desperate trader does not play the odds. Instead of making a decision based on probabilities, the desperate trader makes a decision based on wishful thinking and hope. They expect the price to rise or fall a certain way and they are rooting for it so much that they do not even pay attention to risk management. If a trader were to look at this chart for BTC/USD without any bias, they would see the price trading near a level that used to be a strong support which many were expecting not to be broken. It kept on being tested over and over again and was finally broken to the downside. Now that it has been broken to the downside and the price is testing it again, it is reasonable to think that it will not be easy to break past it. In fact, the price will have to keep testing this level over and over again just like it did when it was a support, if BTC/USD is to eventually break above it. 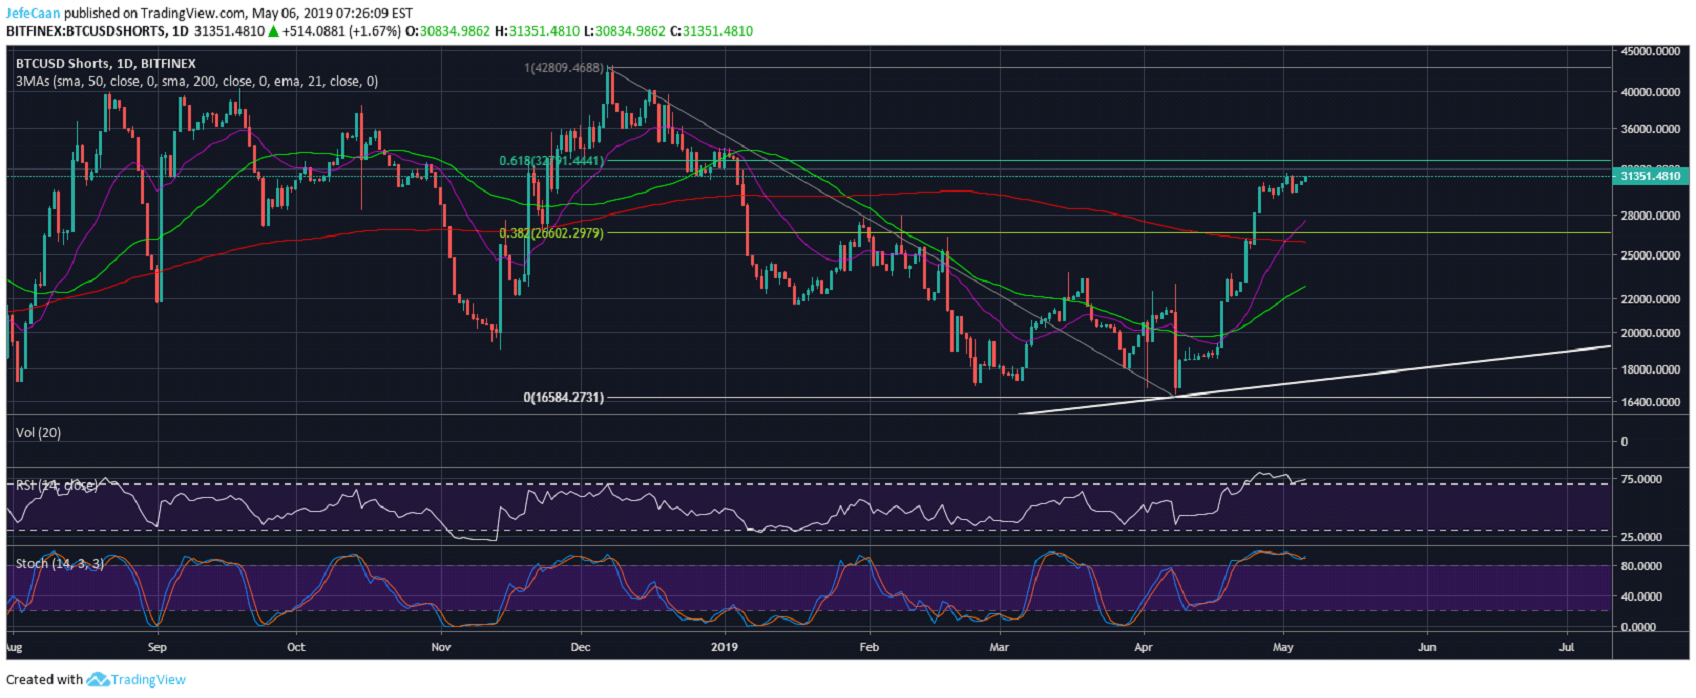
Most Bitcoin (BTC) bulls are willing to ignore all warning and threats as to the limited potential of further upside just on the basis of this one chart. This daily chart for BTCUSDShorts shows the rising number of margined shorts that now seems to be overbought on the daily time frame. However, if we look at this closely, what makes us think this is overbought? The number of margined shorts is still significantly down from its all-time high and the RSI could remain overbought while the number of margined shorts rises further.
Even if it does not, we can see the price of Bitcoin (BTC) hover around $5,800-$6,000 and eventually the shorts are going to lose interest and start giving up. However, to expect that we are on the verge of a big short squeeze that would liquidate all these shorts and pump Bitcoin (BTC) straight to $8,000 breaking this critical resistance zone in one go is nothing short of ludicrous. While we may see minor moves to the upside although the probability of it has certainly decreased now, it is unreasonable to assume that this strong resistance zone that stands between Bitcoin (BTC) and the next bull run is going to be breached in a different manner than it was when it used to be a support.