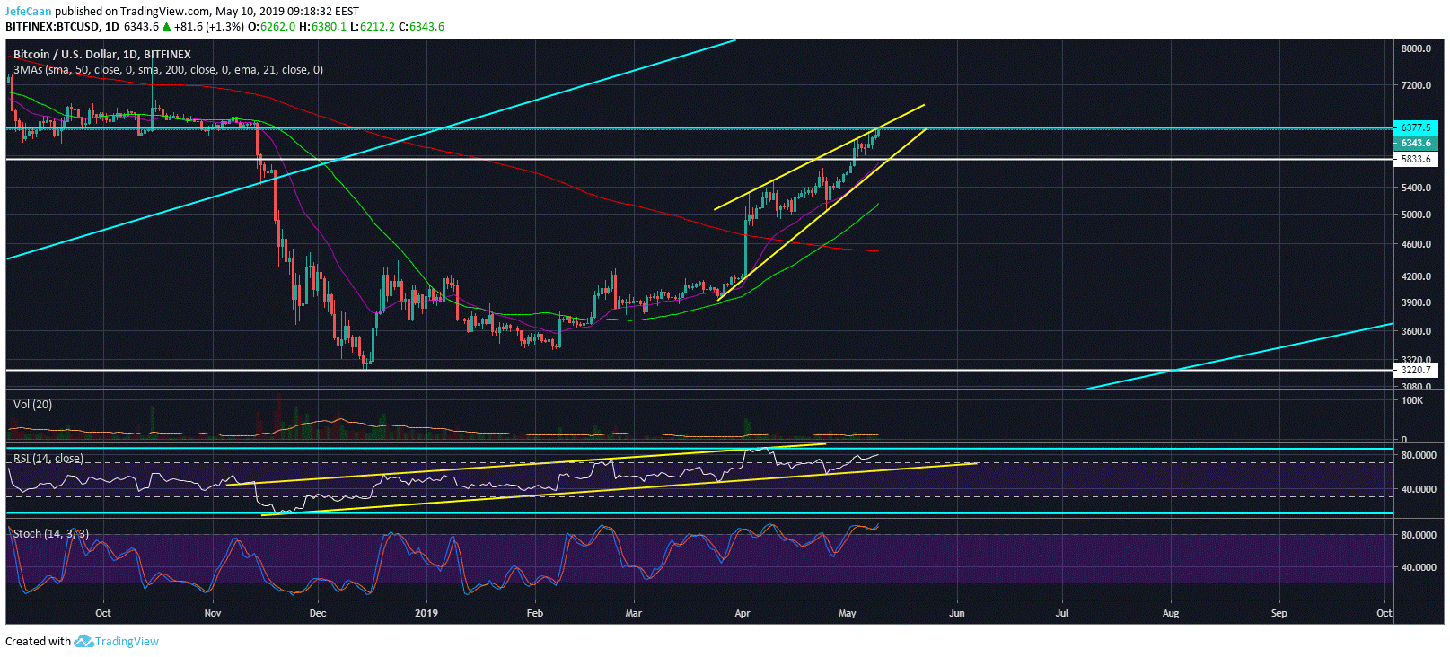
Bitcoin (BTC) has once again got the bulls excited with another rally. The price is now trading above $6,300 is a parabolic manner. The daily chart for BTC/USD shows that the price has yet to break past a critical trend line resistance, but more important than that the horizontal resistance zone is extremely likely to push the price down anytime now. The price will have to fall below the rising wedge sooner or later and when that happens, the bears will take over fast. At the moment, it appears that the bulls are in charge and the price could just keep on rising in the manner it has over the past few weeks. The bulls are too euphoric and the Crypto Fear and Greed Index is at 71 which is a very big deal considering the index was at 74 around the peak of the last bull run.
Two things are happening at this point. The bulls are getting excited and the bears are getting nervous. In the weeks that follow, we are likely to see the number of margined shorts decline while the number of margined longs is expected to rise. As the price trades sideways for long enough, the bulls will take it as a sign of consolidation and expect a rally past $6,500. Even at this point, there is a lot of desperate buying going on as investors who missed the ‘bottom’ at $3,300s are now eager to FOMO into the market. The whales are going to sit back and watch this desperation buying follow through before they pull the trigger. Now, a lot of people might ask, where is the price going to from here? The short answer to that is, “your guess is as good as mine”. The long answer as we have discussed in our previous analyses is based on probabilities.
Certain things have to be established in order to answer that. First of all, never in the history of Bitcoin (BTC) has the preceding market cycle been shorter than the succeeding one. Why anyone thinks this time it will be different is beyond my comprehension. Second of all, if the price is following the 2014-15 cycle, then let it follow that. Following that cycle requires that BTC/USD faces a rejection at the previously broken market structure (now a strong resistance zone) and then a fall to the 200 Week moving average.
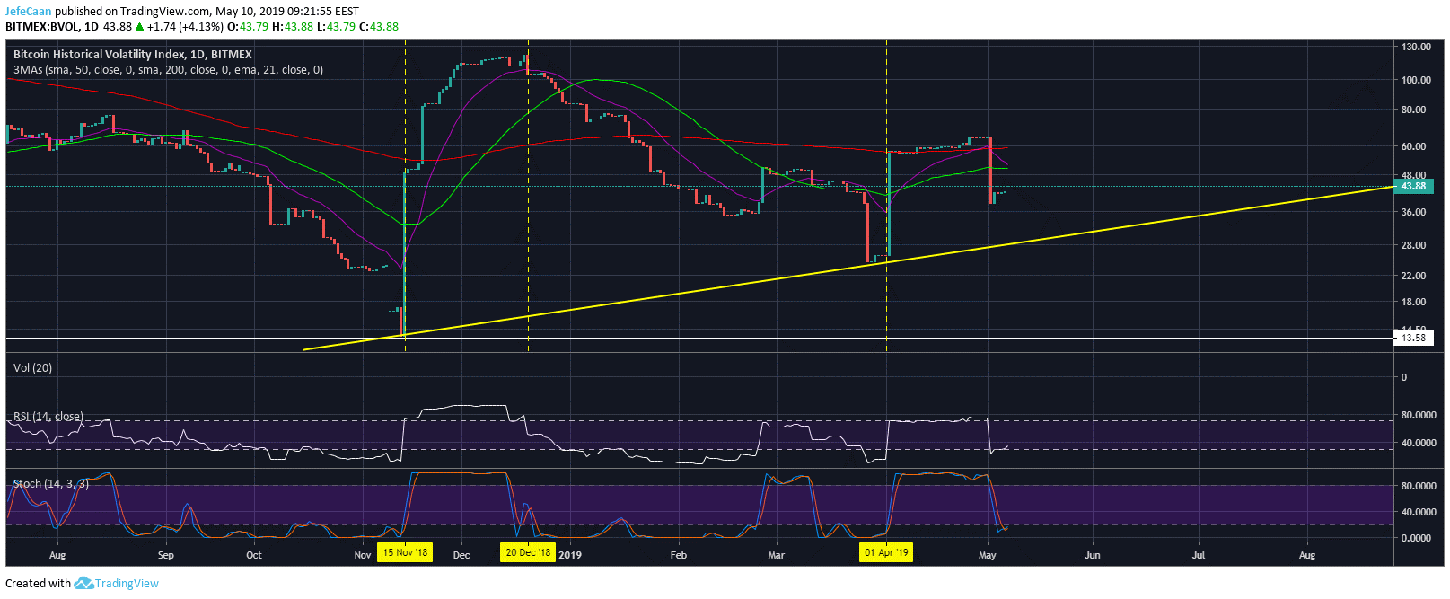
To be reasonable, BTC/USD did break below the 200 week moving average the last time. It has not done that so far and if it were to do that again, it would fall below the December, 2018 lows. The daily chart for Bitcoin Volatility Index (BVOL) shows that the price action is going to be mostly sideways for a while. We can expect a big move around the end of June which is likely to pull BTC/USD to its true bottom. Markets seldom see a bullish trend reversal when the general sentiment is this optimistic. This coupled with rising political and economic tensions point to a bleak future ahead that could create more problems for Bitcoin (BTC) and other cryptocurrencies.