Bitcoin (BTC): How Likely Is A Short Squeeze?
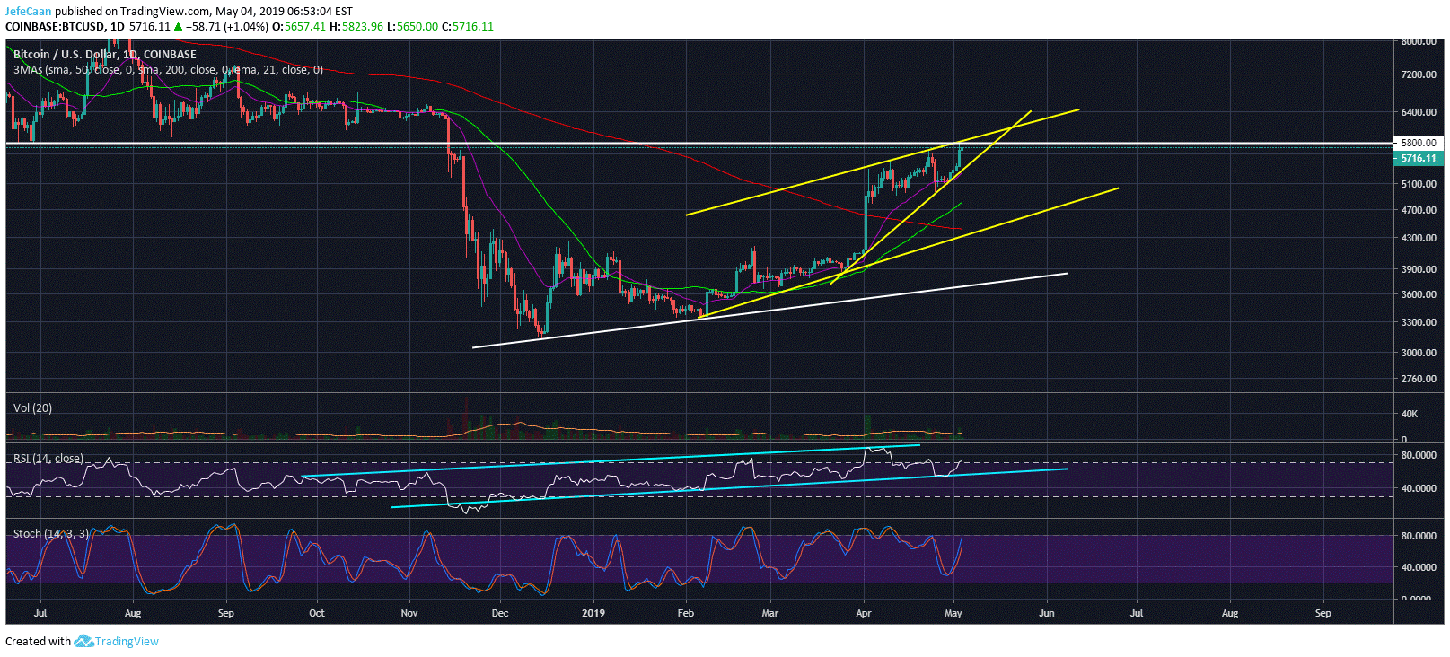
Bitcoin has just tested the most important resistance zone of $5,800-$6,000. This is the zone that stands between BTC/USD and the next bull run. Some analysts and professional traders do not expect the price to break past this level this year regardless of whether they are bullish or bearish. Those that are bearish obviously expect the price to fall a lot lower from here but even those that are sensibly bullish expect the price to trade between a tight range for now and to break this resistance zone around the beginning of 2020. Now certainly there are some people that never expected the $5,800-$6,000 being broken as support but now that the price is trading below it, they expect it to be broken in one go as a resistance. This analysis is for realistic bulls and bears not moon boys or doom boys. For this purpose, we will be taking two possibilities into account at the same time.
The daily chart for BTC/USD shows that the price has just touched $5,800 and is now trading in the $5,700s after a retracement. BTC/USD is trading within a rising wedge under the bearish case and in an ascending channel under the bullish case. We have drawn both of them on the same chart to discuss both cases simultaneously. The bulls and the bears might disagree on a lot of things but this a point where they can find common ground. The bulls think the price is in an ascending channel while the bears think it is in a rising wedge. Let’s say the price is in both at the same time. So, if the price is in a rising wedge, it will have to break to the downside and if it is in an ascending channel, it will still have to break to the downside because it has tested the top of the channel. This means that both the bulls and the bears agree that the price is coming down at least to the bottom of the channel.
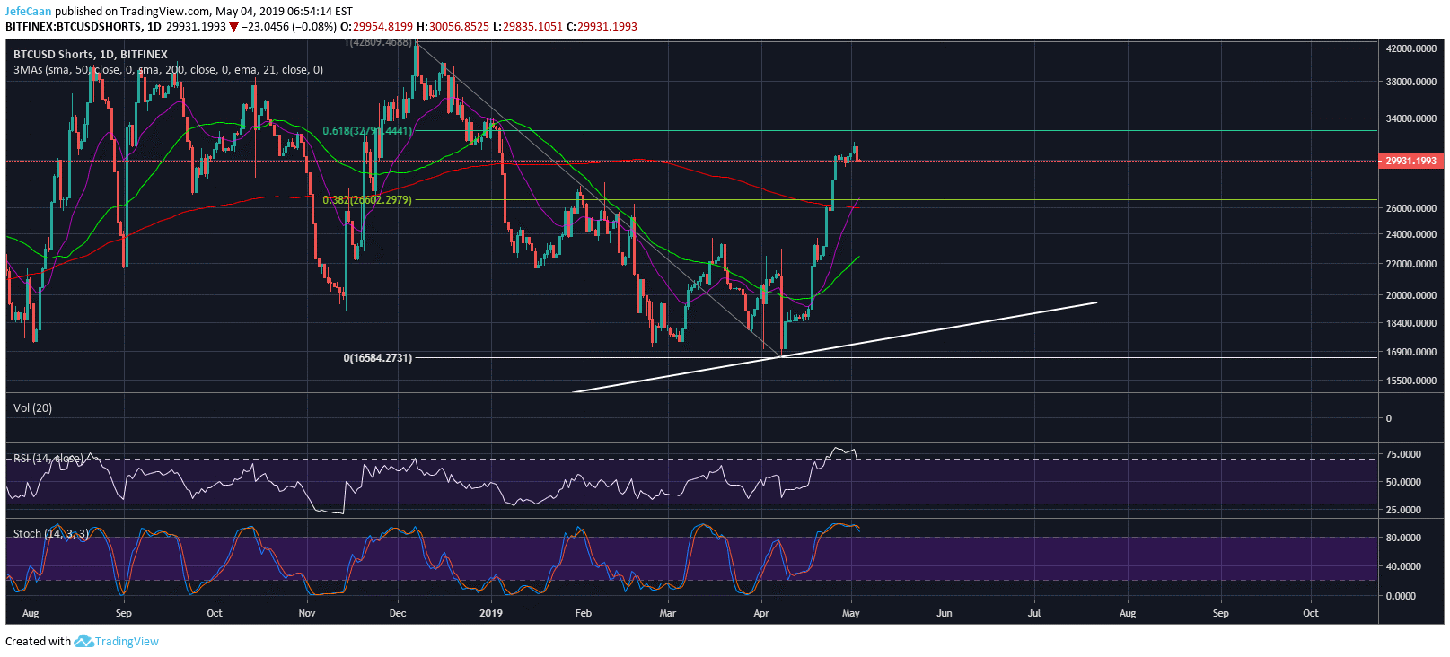
The fact that both the bulls and the bears are agreed on a big fall from current levels decreases the likelihood of a short squeeze at this point significantly. The daily chart for BTCUSDShorts shows that the number of margined shorts is set to decline in the days and weeks ahead. This decline does not have to coincide with a strong rise in BTC/USD because the most likely scenario is that BTC/USD is going to trade sideways around current levels for the next few weeks. This will result in most bears losing faith in the downtrend and we might see the number of margined shorts decline. Never in the history of Bitcoin (BTC) has it broken market structure and then pumped straight above it as if nothing had ever happened. This is not just about Bitcoin (BTC) it is very rare to see any financial asset do something like that.
The $5,800-$6,000 zone was a strong demand zone until the price broke below it and found a temporary bottom at $3,217. After that, $5,800-$6,000 became a strong supply zone. Every time the price of Bitcoin (BTC) nears this level, we will see significant selling. This will continue for a long time until all the sellers are out. Only then the buyers will take control and the price will break above this zone. So far, we are at stage one of this testing and the overly optimistic sentiment in itself is a testament to the fact that the market has yet to inflict maximum pain. In other words, the price does not have much room to go higher from here but it has a lot of room to go lower. It would thus be extremely unreasonable to be bullish on Bitcoin (BTC) relying on the possibility of a short squeeze.