Strong Evidence Bitcoin (BTC) May Not Have Bottomed Yet
Bitcoin (BTC) has been following the 2014-15 cycle throughout the entire bear market. With every passing month, it becomes increasingly clear how closely the price is printing the exact same pattern it did during its previous cycle but with a few differences. If we compare the two cycles, we can see that the correction in the ongoing cycle is more extended compared to the previous cycle. In other words, every fractal of the current bearish cycle takes longer to form compared to that of the previous cycle. This difference is also visible when we compare the previous cycle with the one before it and we will discuss them in detail.
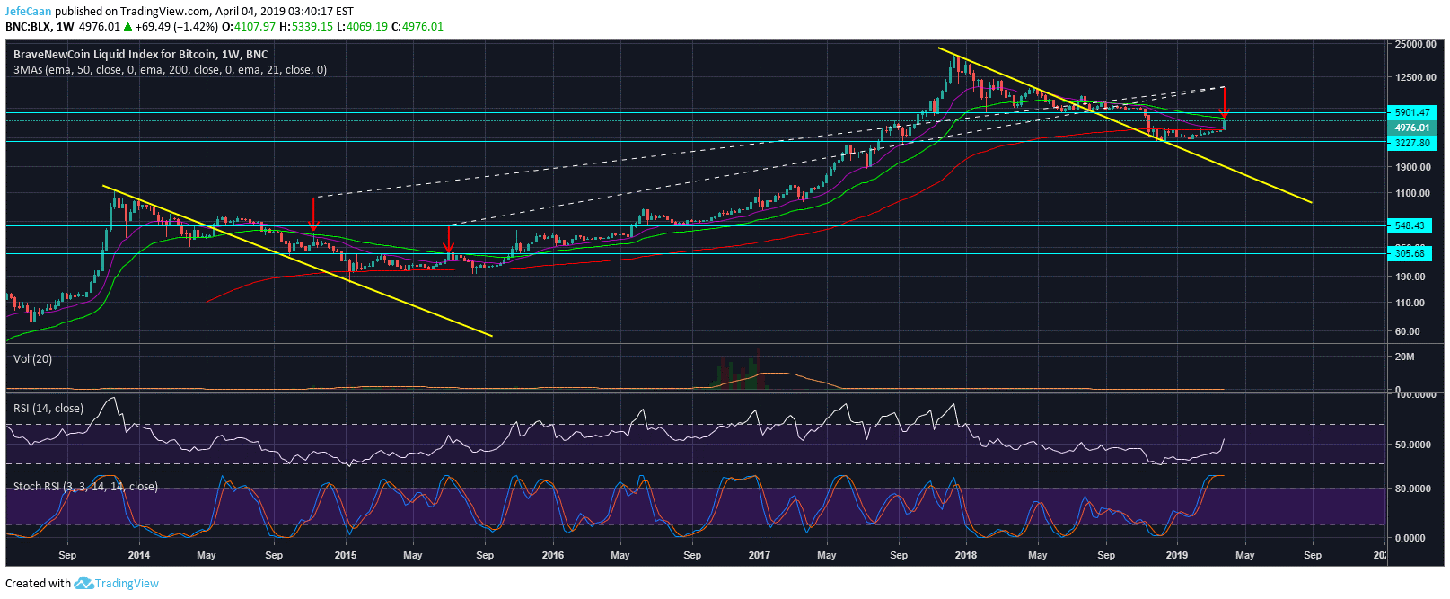
Before we do that, let us look at the weekly chart for BTC/USD. The price is currently in one of two places: either it has run into the 50 Week EMA and is now expected to see more than a 60% decline of capitulation or it has already capitulated and is now expected to put in a double bottom forming higher highs and higher lows. The red arrows on the chart point to the two possibilities that is obvious to spot right away because BTC/USD has currently tested the 50 Week EMA and is now expected to follow one of the two fractals. Those that are bearish but anxiously waiting for the bear market to end are inclined to believe that Bitcoin (BTC) is going to follow the second scenario i.e. a sharp decline to the 200 Week EMA which will be followed by a retest of the market structure around $5,900.
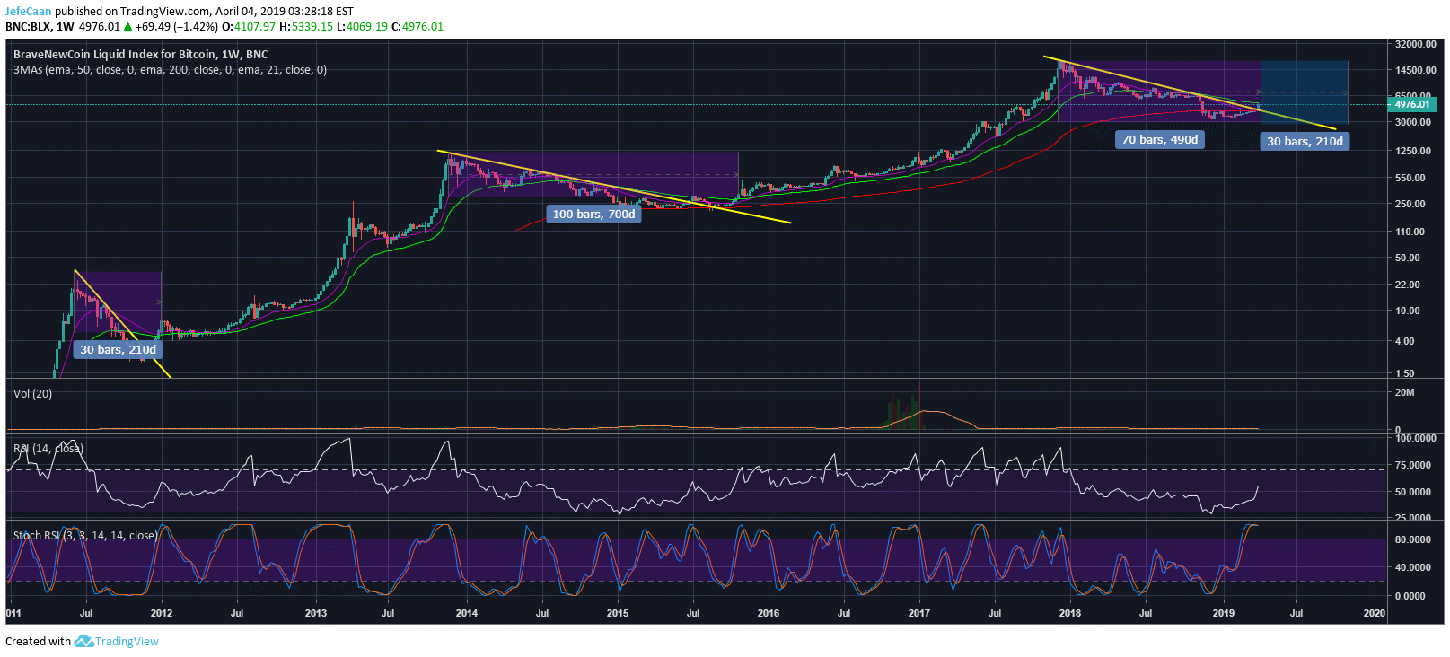
If we assume that Bitcoin (BTC) is following the second scenario (second red arrow to the right on the first chart), that would mean that Bitcoin (BTC) took a total of 479 days to come to this point. Interestingly enough, it took 588 days to come to the second scenario during the previous cycle. Knowing that the market cycles keep on expanding every time, this is a strong reason in itself to determine that we are at the first scenario, not the second which means Bitcoin (BTC) many not even have capitulated yet. To delve further into this comparison of market cycles, let us look at the three cycles outlined on the weekly chart for BTC/USD. To remove confusion and disagreement over what counts as a completion of the bear market, let us assume it to be the time BTC/USD first rose above the 50 Week EMA and remained above it.
We can see that the bear market that began around June, 2011 took around 210 days to come to completion. The bear market of 2014-15 took around 700 days to completion. If we assume that the bear market for the ongoing cycle is over, that would mean that the price would have to rise and stay above the 50 week moving average from this or next week onwards. This would mean that the current bear market lasted for 490 days which is 210 days less than the previous bear market. That cannot be the case when every bear market has been more extended than the previous one. This increase in duration for completion of each fractal has also been observed in many other ways.
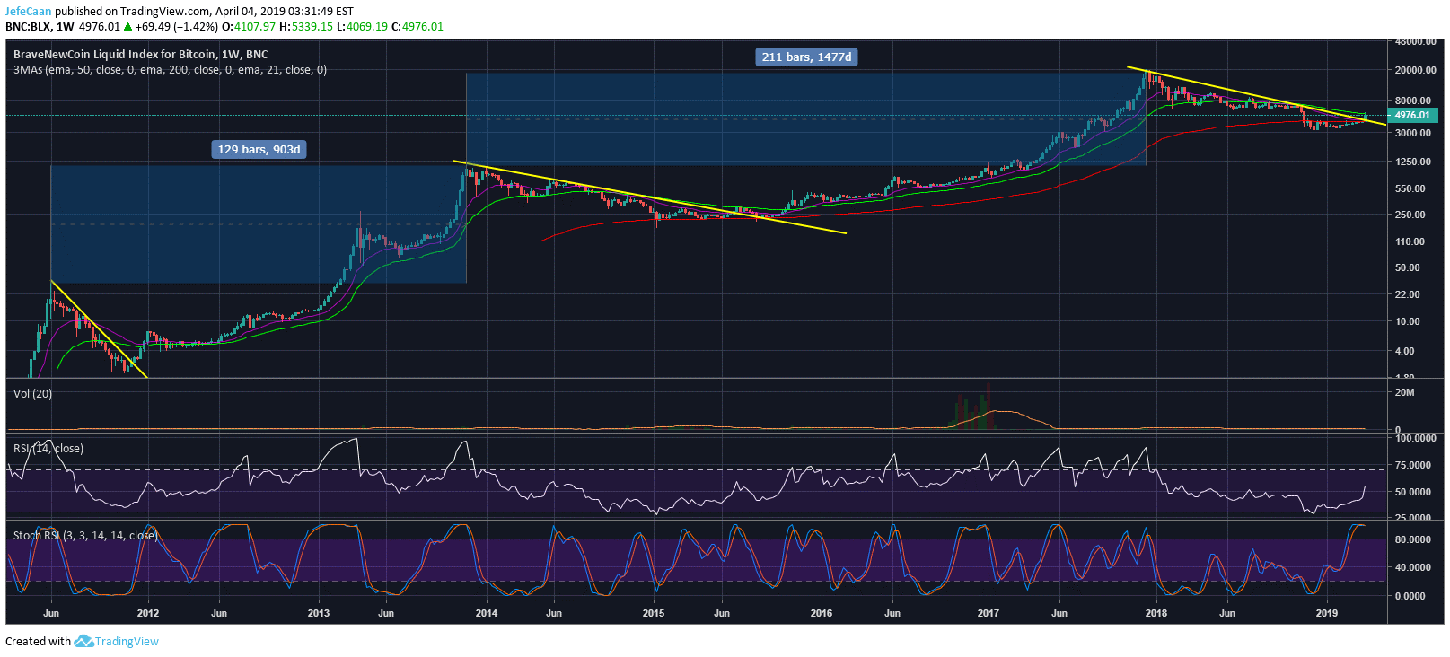
If we look at this chart for BTC/USD, we can see that it took Bitcoin (BTC) 903 days to go from one peak to another between 2011 and 2014. After that, it took Bitcoin (BTC) 1,477 days to go from one peak to another. It is quite clear to see that the cycles keep on expanding and take more time than before, not less! So, if anything Bitcoin (BTC) has at least 210 more days of bear market remaining if not more. This makes a lot of sense from an emerging market or new asset standpoint. Whenever a new asset or market begins trading, we see explosive growth in a short time. However, as time goes by the pace of that growth declines which means the price takes a lot longer to make the same percent gains that it did before.
Those that come from traditional markets and have been trading stocks or indices might be able to relate to this. However, it is still shocking to see that even some of the most widely followed people in this space are calling for the bottom when every single indicator except the recent suspicious pump is pointing to the same conclusion. Even if we set all the technical aside for a moment, let us not forget that whenever a market like this reverses, it inflicts a lot of pain before it does that. So far, we have not seen that pain. Investors and traders are bullish than ever calling for a rise to $6,000 or higher levels. When the price truly bottoms, a lot of people are going to have serious doubts if Bitcoin (BTC) will ever be able to rise again. That is when we will see a trend reversal and beginning of the new bullish cycle.