Sally Ho's Technical Analysis 23 April 2019
Bitcoin
Bitcoin (BTC/USD) gained additional ground during today’s Asian session, trading as high as the 5430.00 level after trading as high as the 5440.84 area during yesterday’s North American session. Today’s intraday low is 5353.71, right around the 76.4% retracement of the move from 5488.00 to 4901.99 and an area that we spotlighted in our 22 April 2019 analysis. Traders are waiting to see if the pair can remain above the 5403.82 level, an area we have discussed extensively that represents the 61.8% retracement of the 6810.00 – 3128.89 range.
BTC/USD is now at its highest level since 10 April and the current upward bias may soon see the 5488.00 area tested, which would represent a new 2019 high. Above current price activity, upside targets include the 5733.84 area, representing the 38.2% retracement of the move from 9948.12 to 3128.89. Other key upside targets include the 5769.98/ 5808.45/ 5941.26/ 6393.93 levels.
Price activity is nearest the 50-bar MA (4-hourly) at 5247.74 and the 50-bar MA (Hourly) at 5312.62
Technical Support is expected around 5349.70/ 5264.14/ 5195.00 with Stops expected below.
Technical Resistance is expected around 5769.98/ 5941.26/ 6393.93 with Stops expected above.
On 4-Hourly chart, SlowK is Bullishly above SlowD while MACD is Bullishly above MACDAverage.
On 60-minute chart, SlowK is Bullishly above SlowD while MACD is Bullishly above MACDAverage.
Ethereum
Ethereum (ETH/USD) was generally stronger during today’s Asian session, trading as high as the 173.37 level after trading as high as the 173.65 area during yesterday’s North American session. Interestingly, the pair is working to establish a technical base around the 170.81 level, representing the 50% retracement of the 185.62 – 156.00 range and an area that we have detailed extensively, including in our 22 April 2019 analysis. The 174.31 area is the 61.8% retracement of the same area and the market may soon test this level.
Today’s intraday high of 173.37 is just below the 61.8% retracement of the move from 177.84 to 166.33. The 175.12 area is the 76.4% retracement of this range, but the pair will first need to contend with 174.31. Additional upside targets include the 178.63 and 183.33 areas.
As we have written about extensively, the 168.47 level represents the 61.8% retracement of the 222.78 – 80.60 range and traders are waiting to see where and when ETH/USD will gain a directional bias. Below this area, the 165.25 level represents the 38.2% retracement of the move from 302.20 to 80.60.
Price activity is nearest the 100-bar MA (4-hourly) at 169.91 and the 100-bar MA (Hourly) at 171.90.
Technical Support is expected around the 165.25/ 162.99/ 156.53 levels with Stops expected below.
Technical Resistance is expected around the 179.40/ 185.62/ 214.08 levels with Stops expected above.
On 4-Hourly chart, SlowK is Bullishly above SlowD while MACD is Bullishly above MACDAverage.
On 60-minute chart, SlowK is Bullishly above SlowD while MACD is Bullishly above MACDAverage.
Litecoin
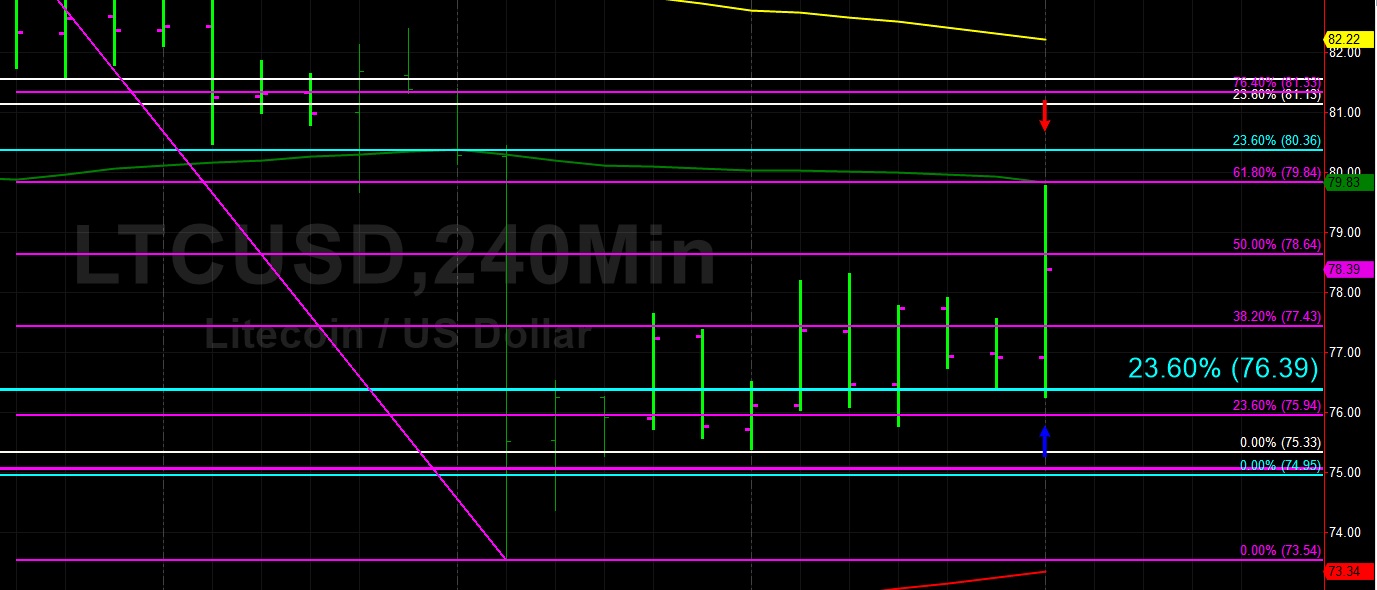
Litecoin (LTC/USD) rocketed higher during today’s Asian session, testing Offers around the 79.84 level, representing the 61.8% retracement of the 83.73 – 73.54 range. Stops were triggered above the 78.64 area, representing the 50% retracement of the same range. Chartists note that the 50-bar MA (4-hourly) is now around 79.84, thus today’s very sharp move higher was also to test the order book up around those levels. Additional upside pressure may see the pair test the 80.36 area, representing the 23.6% retracement of the move from 97.88 to 74.95.
Additional upside price targets include the 81.13/ 83.36/ 84.81 levels. Technicians are eager to see if the 76.39 area becomes a key area of technical support, as it represents the 23.6% retracement of the move from 251.90 to 22.17.
Price activity is nearest the 50-bar MA (4-hourly) at 79.84 and the 100-bar MA (Hourly) at 79.39.
Technical Support is expected around the 72.10/ 67.17/ 62.62 levels with Stops expected below.
Technical Resistance is expected around the 87.39/ 92.56/ 102.26 levels with Stops expected above.
On 4-Hourly chart, SlowK is Bullishly above SlowD while MACD is Bullishly above MACDAverage.
On 60-minute chart, SlowK is Bullishly above SlowD while MACD is Bullishly above MACDAverage.
Bitcoin Cash
BCH/USD (Bitcoin Cash/ US dollar) exploded higher during the Asian session, trading as high as the 312.02 level after chunky Stops were elected above the 300.52 and 305.36 areas, representing the 61.8% and 76.4% retracements of the recent move from 313.20 to 280.00. The 314.12/ 315.92 levels represent additional upside targets. BCH/USD continued to orbit the 292.37 level prior to today’s sharp move higher, representing the 38.2% retracement of the 354.17 – 254.17 range.
As we have noted, downside targets include 284.15/ 272.69. On the downside, chartists are looking to see if the pair can derive technical Support at key areas including the 284.15/ 277.77 levels.
Price activity is nearest the 50-bar MA (4-hourly) at 303.40 and the 200-bar MA (Hourly) at 302.92.
Technical Support is expected around the 293.41/ 287.56/ 277.46 levels with Stops below.
Technical Resistance is expected around the 332.55/ 349.99/ 366.11 levels with Stops above.
On 4-Hourly chart, SlowK is Bullishly above SlowD while MACD is Bullishly above MACDAverage.
On 60-minute chart, SlowK is Bullishly above SlowD while MACD is Bullishly above MACDAverage.
