Bitcoin
Bitcoin (BTC/USD) notched solid gains during the Asian session, reaching the 5272.32 level before some profit-taking emerged. This was the pair’s strongest print since 10 April and minor Stops were reached just above the 5264.14 level, representing the 61.8% retracement of the move from 5280.72 to 4901.99, and an area that we spotlighted in our 15 April 2019 analysis. Follow-through buying pressure could see BTC/USD take a run at 5349.70, representing the 76.4% retracement of the same range.
As we reported in our 16 April 2019 analysis, the pair found a Bid during yesterday’s North American session around the 5013.16 area, representing the 61.8% retracement of the 4901.99 – 5191.19 range.
Another strong technical clue emerged today when the pair found a decent Bid at the 5178.45 area, right around the 38.2% retracement of the 8488.00 – 3128.89 range as noted in our 16 April 2019 analysis. As we also wrote and expected, Stops were elected yesterday above the 50-bar MA (4-hourly) at 5136.61.
As noted in our 15 April 2019 analysis, any additional buying power will spotlight the 5349.70 levels.
Another major upside target is 5403.82, representing the 61.8% retracement of the 6810.00 – 3128.89 range.
Price activity is nearest the 50-bar MA (4-hourly) at 5135.19 and the 200-bar MA (Hourly) at 5139.05.
Technical Support is expected around 5040.29/ 4877.05/ 4582.91 with Stops expected below.
Technical Resistance is expected around 5403.82/ 5769.98/ 5941.26 with Stops expected above.
On 4-Hourly chart, SlowK is Bullishly above SlowD while MACD is Bullishly above MACDAverage.
On 60-minute chart, SlowK is Bearishly below SlowD while MACD is Bullishly above MACDAverage.
Ethereum
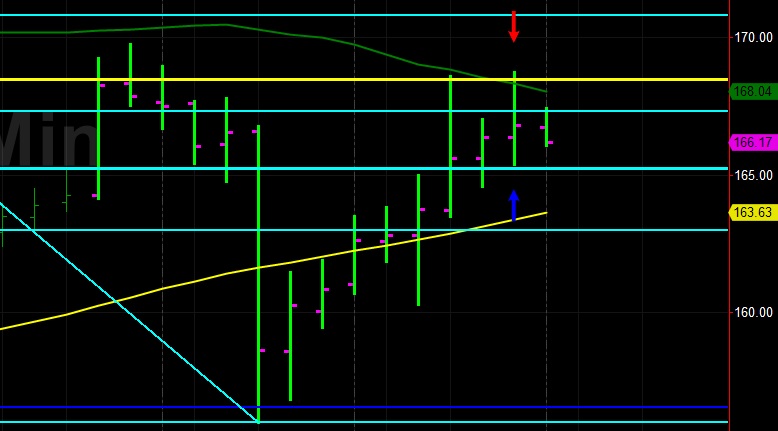
Ethereum (ETH/USD) extended yesterday’s price gains and now has eight consecutive 4-hourly bars with a higher High and/ or a higher Low. Today’s intraday High is 168.73, just above the 168.47 area that we have written extensively about. This level represents the 61.8% retracement of the 222.78 – 80.60 range, as noted in our 16 April 2019 analysis. As we also noted in our analysis yesterday, the 167.31 level represented the 38.2% retracement of the depreciation from 185.62 to 156.00, and some Stops were elected above this area.
ETH/USD could not sustain brief tests above the 50-bar MA (4-hourly), only briefly trading above the 168.33 area. Follow-through buying activity could see the 170.81/ 174.31 areas tested, key retracement areas related to the 185.62 – 156.00 range.
Price activity is nearest the 50-bar MA (4-hourly) at 168.04 and the 100-bar MA (Hourly) at 164.33.
Technical Support is expected around the 156.53/ 151.69/ 144.09 levels with Stops expected below.
Technical Resistance is expected around the 179.40/ 185.62/ 214.08 levels with Stops expected above.
On 4-Hourly chart, SlowK is Bullishly above SlowD while MACD is Bullishly above MACDAverage.
On 60-minute chart, SlowK is Bearishly below SlowD while MACD is Bullishly above MACDAverage.
Litecoin
Litecoin (LTC/USD) came off a little bit during the Asian session as the pair continues to orbit the 100-bar MA (4-hourly), currently around 80.04. Some Stops were reached above the 81.81 area during the move to intraday Highs around the 82.18 area, and the pair is now trading between the 50-bar MA and 100-bar MA on 4-hourly charts.
The 80.36 level is also a key level that technicians are watching, representing the 23.6% retracement of the 97.88 – 74.95 range. As we noted in our 16 April 2019 analysis, LTC/USD will need to contend with technical Resistance around the 83.71 and 86.42 areas, representing short-term retracement levels associated with the move from 97.88 to 74.95.
As noted in our 15 April 2019 analysis, stronger upside targets include the 87.39 level, representing the 38.2% retracement of the 192.89 – 22.17 range.
Price activity is nearest the 100-bar MA (4-hourly) at 80.04 and the 50-bar MA (Hourly) at 79.86.
Technical Support is expected around the 72.10/ 67.17/ 62.62 levels with Stops expected below.
Technical Resistance is expected around the 87.39/ 92.56/ 102.26 levels with Stops expected above.
On 4-Hourly chart, SlowK is Bullishly above SlowD while MACD is Bullishly above MACDAverage.
On 60-minute chart, SlowK is Bearishly below SlowD while MACD is Bearishly above MACDAverage.
Bitcoin Cash
BCH/USD (Bitcoin Cash/ US dollar) ran out of some steam during the Asian session as the pair tested the 322.00 figure but then came off to the 310.24 level. The pair continues to the orbit the 315.97 area, representing the 61.8% retracement of the move from 354.17 to 254.17.
Bids emerged during yesterday’s North American session around the 302.66 area, right around the 61.8% retracement of the move from 332.64 to 254.17.
As we noted in our 16 April 2019 analysis, chartists are eyeing the 326.27 area as a short-term upside price target, representing the 76.4% retracement of the recent move from 335.00 to 298.00.
Price activity is nearest the 50-bar MA (4-hourly) at 292.56 and the 50-bar MA (Hourly) at 311.41.
Technical Support is expected around the 277.46/ 265.55/ 254.17 levels with Stops below.
Technical Resistance is expected around the 332.55/ 349.99/ 366.11 levels with Stops above.
On 4-Hourly chart, SlowK is Bearishly below SlowD while MACD is Bullishly above MACDAverage.
On 60-minute chart, SlowK is Bearishly below SlowD while MACD is Bearishly below MACDAverage.