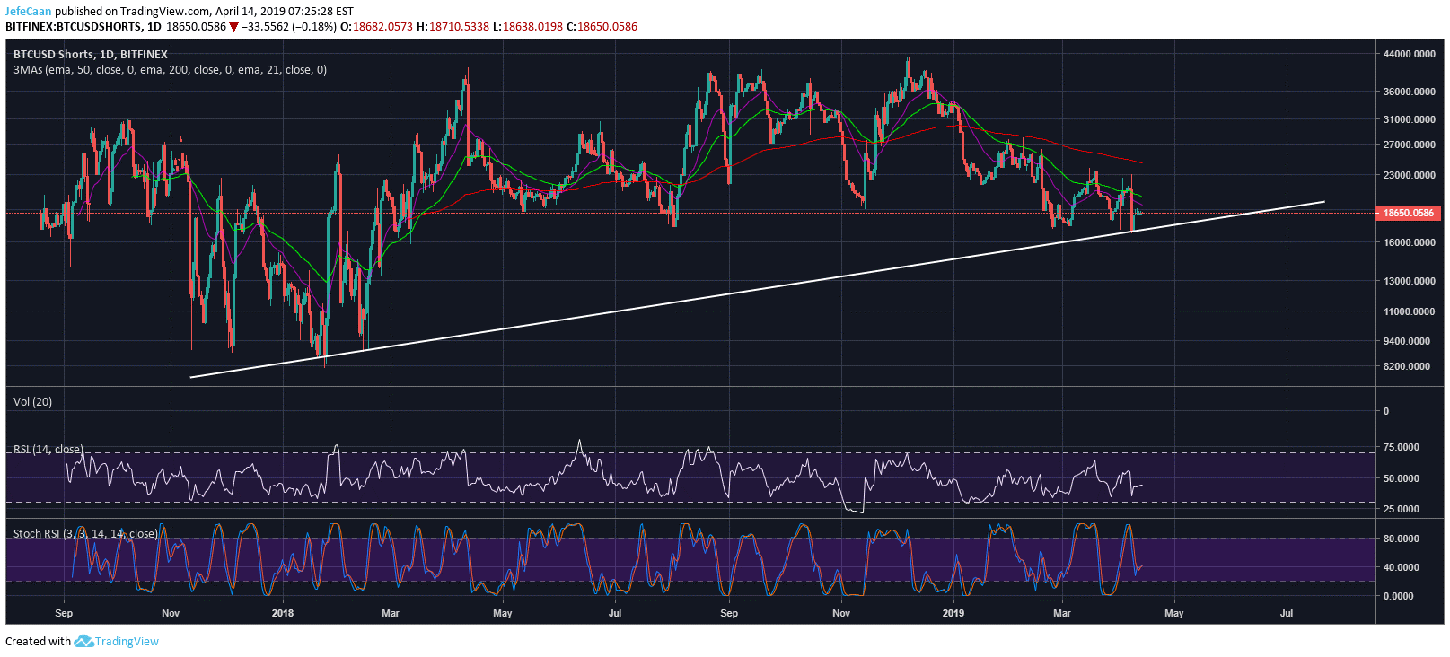
Bitcoin (BTC) bears seem to be in a position of control once again after a long period of indecision. The daily chart for BTCUSDShorts shows that the number of margined shorts started to decline towards the end of last year. The price made a bullish recovery during that time and the bears were quick to lose sight of the big picture. Currently, BTCUSDShorts is resting on a strong trend line support and is expected to begin a new uptrend as early as next week. It is important to note though that Bitcoin (BTC) is now overbought short term (4H) and long term (1W) but not mid-term (1D). In other words, we could see the price fall in the next few days but it will have to rise again before the next major decline sets in.
All of these developments confirm our earlier view that the ongoing cycle has to be longer than the previous one. The price action clearly shows us that BTC/USD is unwilling to make a series of moves up and down in one go. Instead, it will keep on stalling every decisive move to the upside or downside as it has done in the past few months. The price could have just declined in the past few weeks and completed its correction. The weekly overbought conditions would have reverted to mean and the price would have been ready to begin a new bullish cycle. However, nothing of the sort happened because BTC/USD is not ready for another cycle yet. Retail bulls and bears both expect things to be easy and straightforward while the market makers intend to keep them thinking that way as they take the opportunity to swindle both of them.
For market makers, this is one of the best times to make money. The bears expect the price to fall straight towards $1,800 and the bulls expect the price to fly straight towards $8,000. In addition to that, there is a new class of neophyte traders emerging that seems to be complacent as well in addition to being inexperienced. Most of these traders will keep on speculating between $6,000 and $3,000 and this is where the market makers will make the most money. It is thus reasonable to expect that the price may continue to trade in this range for a lot longer than most of us anticipate.
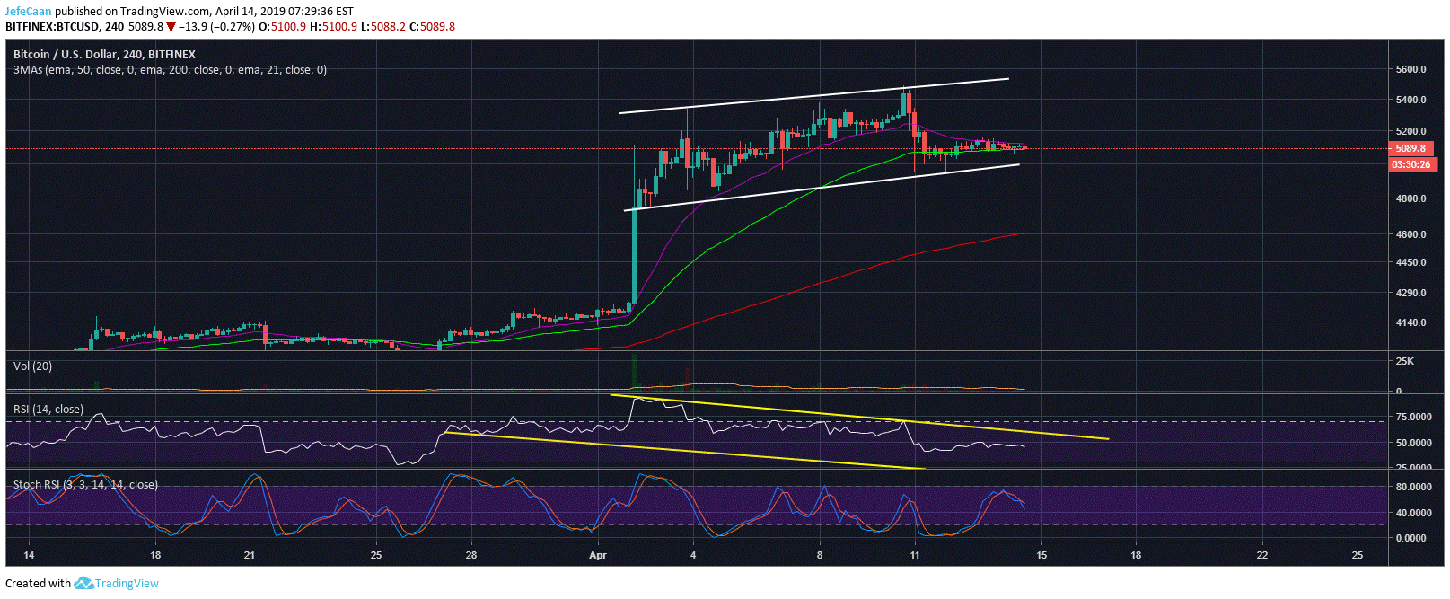
The 4H chart for BTC/USD shows that Bitcoin (BTC) attempted to break past a critical resistance the past few days but it was in fact a fake out and the price started to decline sharply. Since then, the price has been consolidating and is now expected to make its next big move. The Stochastic RSI on the 4H chart hints that this move could be to the downside. However, the RSI leaves room for both possibilities. It would not be surprising to see the price flash crash to the 200 EMA on the 4H time frame and then rise towards $6,000. The price is unlikely to break past $6,000 if it ends up rallying that far and will ultimately have to decline in the weeks ahead.