Why Bitcoin (BTC) Could Still Fall Below $3,000
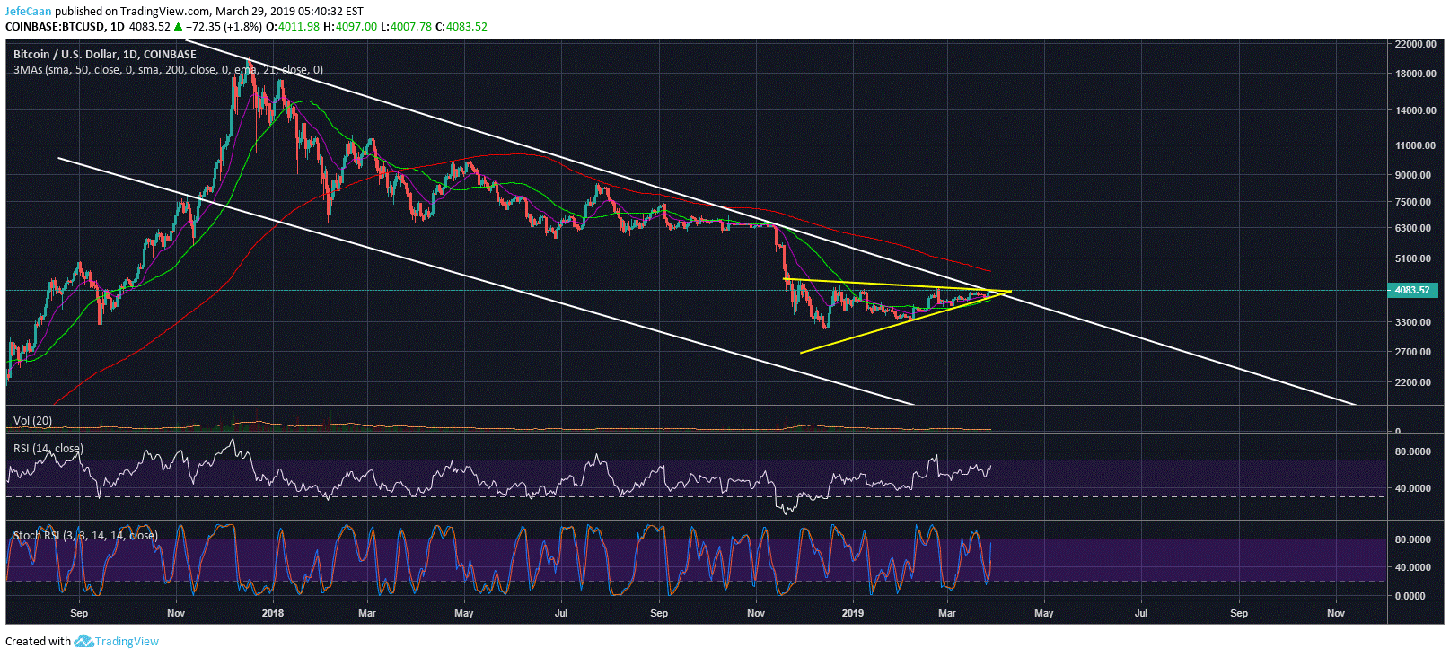
Bitcoin (BTC) is up against a strong resistance as CME Futures expire today. This means that next month will be game-changing for BTC/USD. We will have a clear direction as to where the price is headed because the past few months have been sideways movement for the most part. If BTC/USD breaks above the trend line resistance which is very improbable, we could see an end to this bear market and a new bullish cycle could begin as early as next month. On the other hand, if BTC/USD faces a rejection at this trend line resistance and the bear pennant results in a strong decline to the downside, we will see a bearish continuation that could pull the price towards $3,000 and possibly well below it till Bitcoin (BTC) finds its true bottom.
The descending channel seen on the daily chart for BTC/USD is yet to be broken to either side. The probability of this channel being broken to the downside is close to zero as that would meant that Bitcoin (BTC) is a scam and it is going to zero. However, that does not mean that BTC/USD cannot fall towards the bottom of this channel. In fact, that appears to be the most probable scenario at this point as Bitcoin (BTC) is massively overbought on the weekly time frame and most technical patterns and indicators point to a major decline in the weeks ahead. This is further strengthened by the fact that the stock market is also due for a major decline short term and if the stock market falls, then something as speculative as Bitcoin (BTC) will fall a lot more just as we have seen in the past.
Proponents of Bitcoin (BTC) often argue that Bitcoin (BTC) is digital gold and thus it will trade inversely to the stock market. However, that could not be farther from the truth. We are still in very early days in this market and Bitcoin (BTC) is not just a standalone digital currency; it is part of an emerging market of cryptocurrencies. Like any emerging market, Bitcoin (BTC) and other cryptocurrencies will have a very hard time holding their ground once the S&P 500 starts to decline. A lot of major indicators in the stock and bond market already support this theory but even if we put that aside, studying Bitcoin (BTC)’s own charts points to the same conclusion.
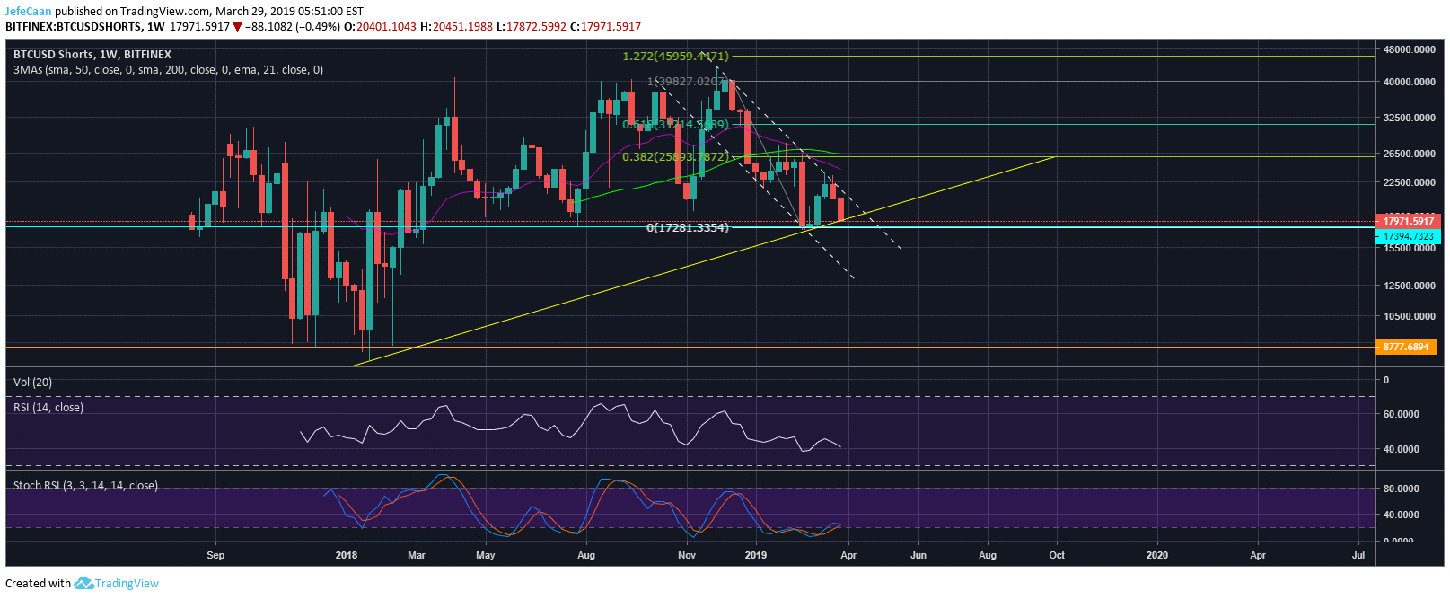
The weekly chart for BTCUSDShorts shows how hard the past few months have been on the bears. The number of margined shorts declined all the way from its peak in December, 2018 and has now found support atop a long term trend line. This means that we could expect the number of margined shorts to increase over the next few weeks which means sell pressure on Bitcoin (BTC) will rise once again. If this trend line holds, we are also likely to see BTCUSDShorts reach a new all-time high which would coincide with Bitcoin (BTC) finding its true bottom in the weeks and months ahead.