Ethereum (ETH) Holds Ground Above 21 Day EMA, Price Expected To Rally Ahead
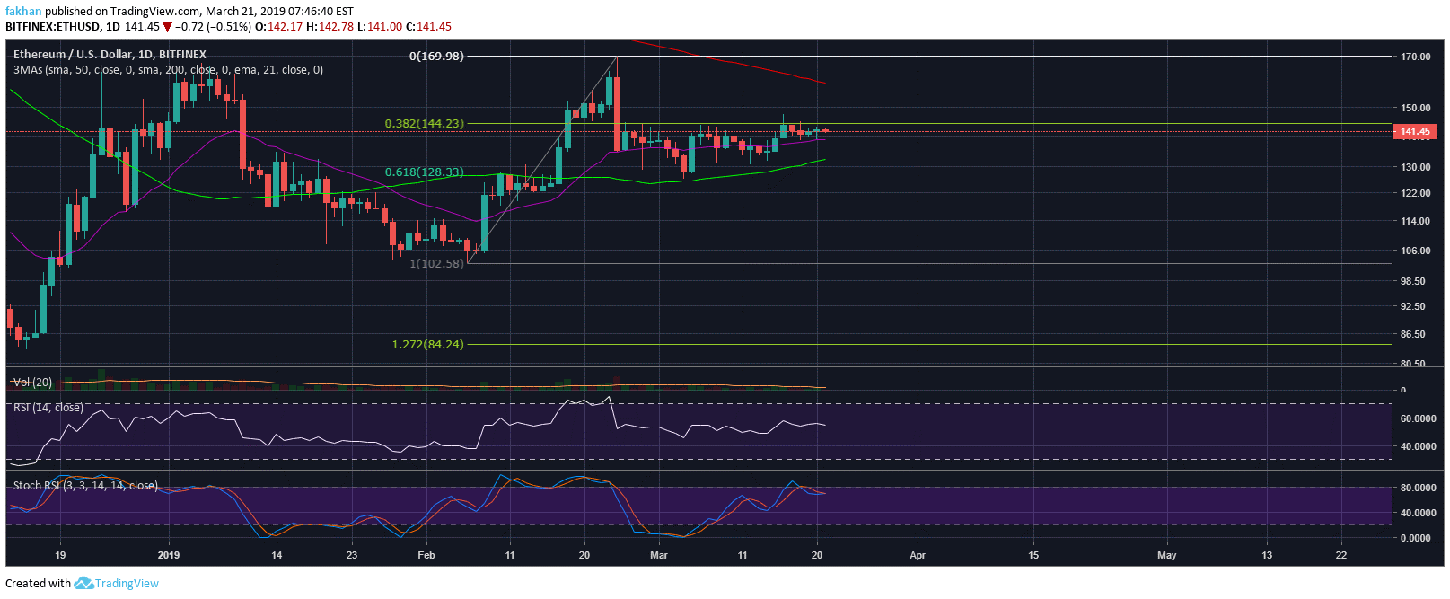
Ethereum (ETH) holds strong above the 21 day exponential moving average for now but the price could be at risk of significant downside if it slips below this level. The daily chart for ETH/USD shows that the price is currently sandwiched between the 21 day exponential moving average which serves as a strong support and the 38.2% fib retracement level which serves as strong resistance. This resistance has been tested for the past few weeks but ETH/USD has failed to break above it. This time, the 21 day EMA has been instrumental in giving the price a support base to strike back at this level. If ETH/USD fails to break past this resistance once again, we could expect Ethereum (ETH) to slide below the 21 day EMA to eventually find support atop the 50 day moving average and then gradually test the 61.8% fib retracement level as support.
The daily chart for ETH/USD shows that the price is overbought short term and therefore, there is not much room for a strong move to the upside. The best case scenario for the bulls would be to see the price test the 200 day moving average but we expect it to meet heavy resistance there. On the other hand, if the price were to slide below the 50 day moving average in case of a decline, we expect it to fall below $90 and settle around $84 before any potential declines. Ethereum (ETH) is a very promising blockchain project with a lot of future potential but like the rest of the market, it remains at risk of further sell off in the weeks ahead. The overbought conditions seen on the weekly time frame for ETH/USD have not been seen even when the price topped out around December, 2017.
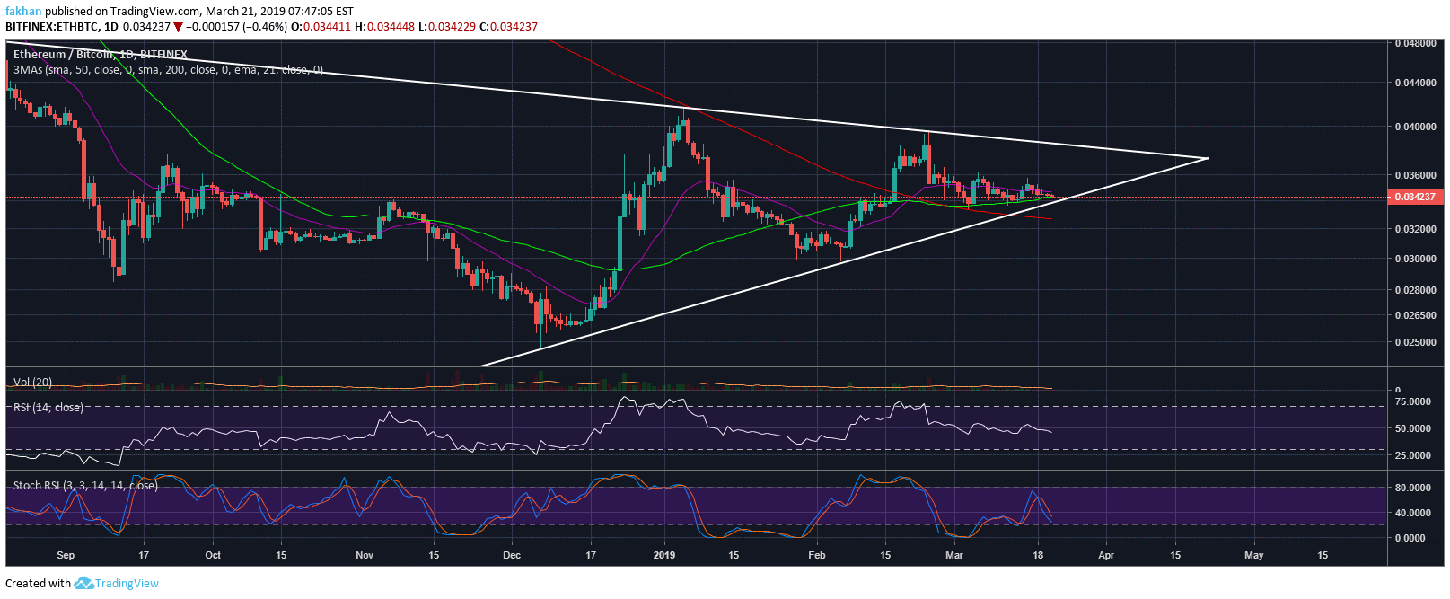
Ethereum (ETH) formed a golden cross trading against Bitcoin (BTC). The daily chart for ETH/BTC shows that the price formed a golden cross just before the beginning of this month when the 50 day moving average crossed above the 200 day moving average. However, as we can see that did little good to the price and we did not see anything significant. Under normal circumstance, a golden cross is very bullish for the price and if this had happened during a bull market we would have expected the price to fly. However, the fact that it did not do so indicates that there might be further downside to come.
Ethereum (ETH) has been trading in a symmetrical triangle against Bitcoin (BTC) for the past few months but it is close to reaching the extreme end of this triangle. This means that the price will have to break out to either side by the end of April, 2019. We expect this break to the downside because Ethereum (ETH) has yet to find its true bottom. This decline will most likely be unlike anything we have seen before and the price would crash hard in a matter of just a few hours. It will be followed by further downside for a few weeks till the price finds a bottom and trading conditions revert to mean.