Bitcoin (BTC) Volatility Index Hints This Week’s Close Key For Future Direction
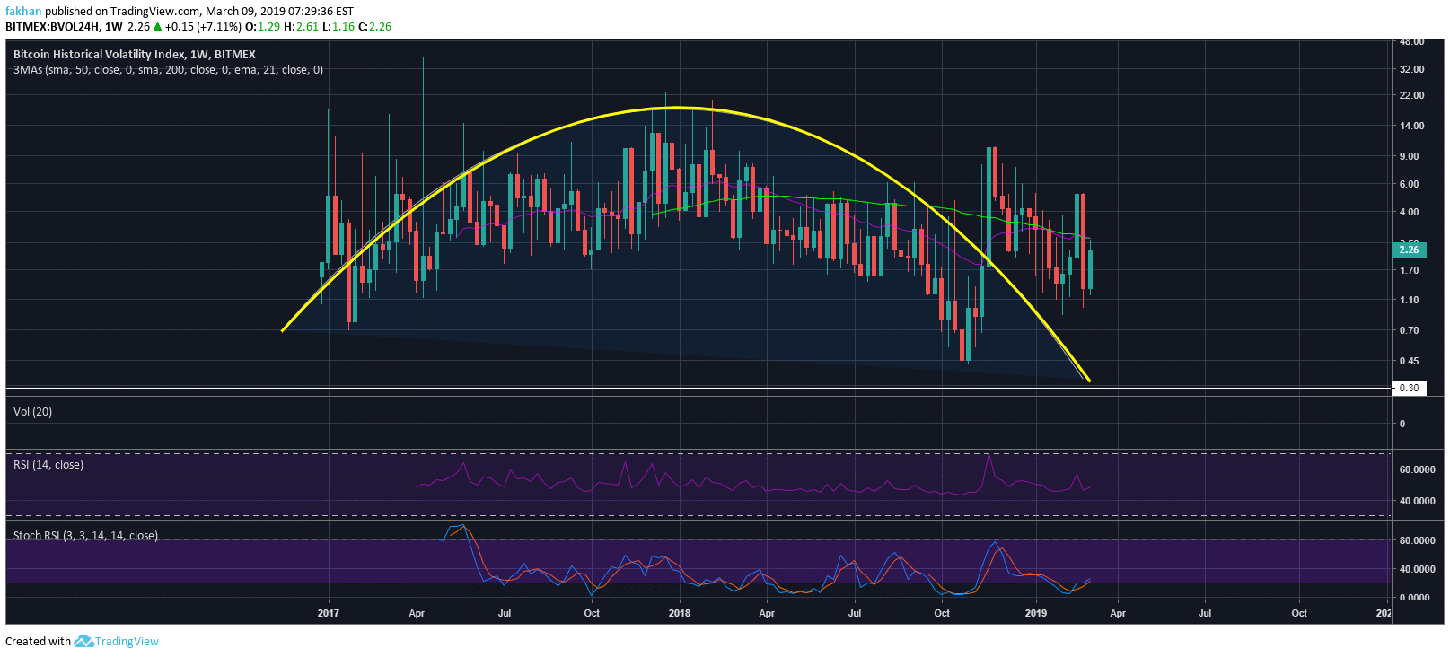
Bitcoin (BTC) was supposed to make a decisive move a few weeks back but a flash crash just before the weekly close changed the plan. However, this time things seem to be headed the right way and we expect the price will close the week above $4,000. The weekly chart for Bitcoin Historical Volatility Index (BVOL24H) shows that if the weekly candle closes in its current position i.e. below the 50 week moving average we could expect the volatility to continue to fall in the weeks ahead which would accelerate Bitcoin (BTC)’s fall to its true bottom. On the other hand, if it closes above the 50 week moving average which is not very probable but possible nevertheless, we may expect extended sideways movement in the weeks ahead.
The weekly chart for Bitcoin Historical Volatility Index (BVOL24H) shows that the volatility was near its all-time-high when Bitcoin (BTC) was about to top out. By the same rationale, we could expect the price of Bitcoin (BTC) to be near its bottom when the volatility bottoms out. At the moment, the volatility index tells us two things. Either the price has bottomed or it has not. If we consider that Bitcoin (BTC) has bottomed, then the December, 2018 low was the bottom and the volatility may not even drop to those levels. If it drops to that level again, it might be to form a double bottom. However, we do not believe that to be the case. We believe that the volatility is expected to fall lower than the December, 2018 low and so will the price because we do not believe BTC/USD has bottomed yet.
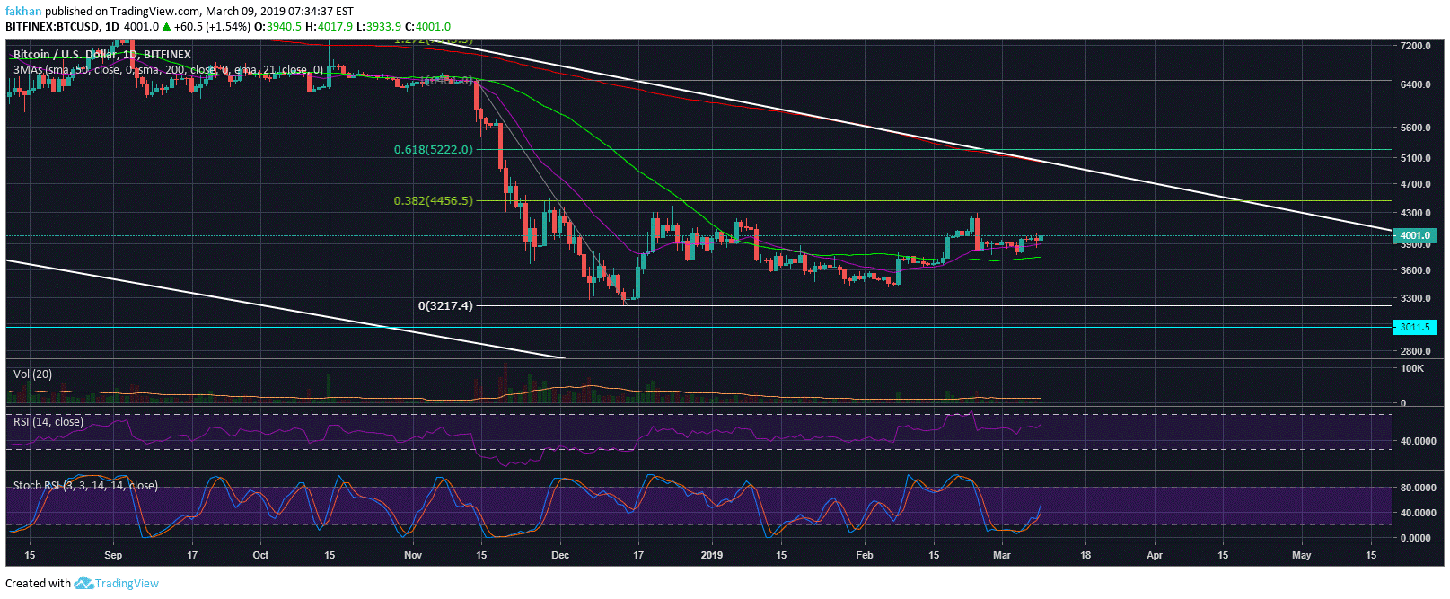
The daily chart for BTC/USD shows that the price has some room to rally towards the 38.2% Fibonacci retracement level before it can fall further. If we look at the price action, it does not seem very likely that BTC/USD might rally above $4,456 but it still remains a possibility. The best bullish scenario would be for the price to rally towards the 61.8% Fib retracement level. This would push the price above $5,200. The Stochastic RSI for BTC/USD on the daily time frame indicates that the probability of such a move is very low. Instead, we are more likely to see the price close the weekly candle around $4,450.
Trading volume for BTC/USD on the daily time frame points to the possibility of a sharp move to the upside towards the end of the week. For now, we expect Bitcoin (BTC) to continue to trade sideways. The task at hand here is for the whales to succeed in making BTC/USD close near 4,450 on the weekly time frame. When that happens, we will have the perfect bearish setup and BTC/USD will be expected to decline towards its true bottom. We believe that BTC/USD will take at least two more months to find its true bottom. There are still a lot of buyers around the $3,000 level and the price will have to remain above that level for a long time before it can fall towards its true bottom between $1,000 and $3,000.