EUR/USD Hints At Bitcoin (BTC)’s Next Move After An Aggressive Rally
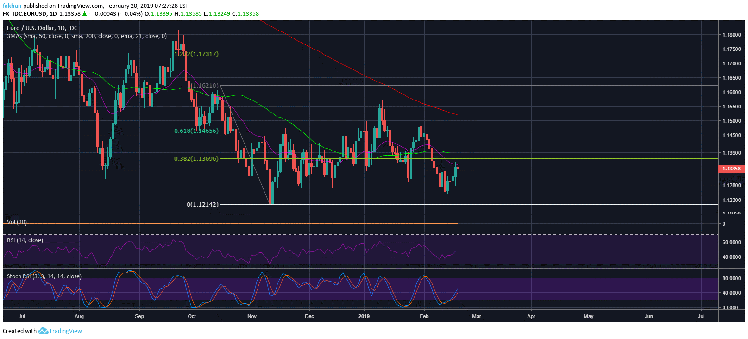
Bitcoin (BTC) has rallied aggressively over the past 48 hours which many believe to be a sign of a trend reversal or bullish momentum returning back to the market. However, I do not agree with it for the most part as I believe this rally had more to do with the rise in EUR/USD than Bitcoin (BTC) itself. As we can see on the daily chart for EUR/USD, the Euro has been on a roll for the past few days. When EUR/USD rises, it means the US Dollar (USD) goes down. So, when the US Dollar (USD) goes down, we see a higher price of Bitcoin (BTC). Now one could say we have seen a sudden return of bullish momentum to the market or one could go look at the real factors responsible for the sudden surge in the price of Bitcoin (BTC).
It is a fact that BTC/USD has long been due for a correction to the upside as we discussed in many of our previous analyses. As it happened, that rally profited off the rise in EUR/USD but had nothing much to do with Bitcoin (BTC) itself. The S&P 500 has been rising for the past few days profiting off a weak dollar same as Bitcoin (BTC). So, what does it all mean for Bitcoin (BTC)? While we have been in a bear market for far too long and a trend reversal is expected in the near future, let us not forget that this trend reversal will take its time. It cannot be just one sudden break out to a new all-time high. That being said, those of you who are reluctant to sell their coins at this stage anticipating a break to the upside anyway, you are better off holding your cryptocurrencies if you accumulated at levels we previously discussed.
However, now is not the time to be buying Bitcoin (BTC). If we look at the daily chart for EUR/USD once more, we can see that the price struggled to get past the 61.8% Fib retracement level but it failed many a time. It succeeded around early 2019 but soon had to fall back below that level. This time though, the price has broken below the 38.2% Fib level and will now be testing it as a resistance. This could go on for a while which means it might take Bitcoin (BTC) weeks if not months to find its actual bottom.
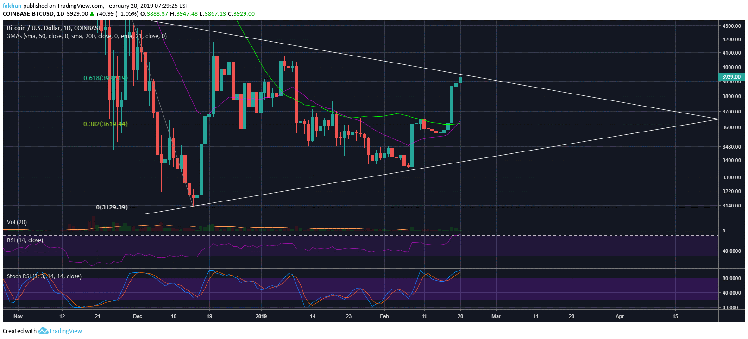
The daily chart for BTC/USD also shows quite clearly what is going on. The price has run into the 61.8% Fib retracement level and is now expected to fall back as this level also coincides with a critical trend line resistance. While it is possible that the price might end up breaking to the upside, the probability of that happening is far too low and we might see a decline to the 38.2% Fib level at least if not a lot lower in the near future.