Ethereum (ETH) Still Likely To Rally Towards $170 After A Sharp Decline
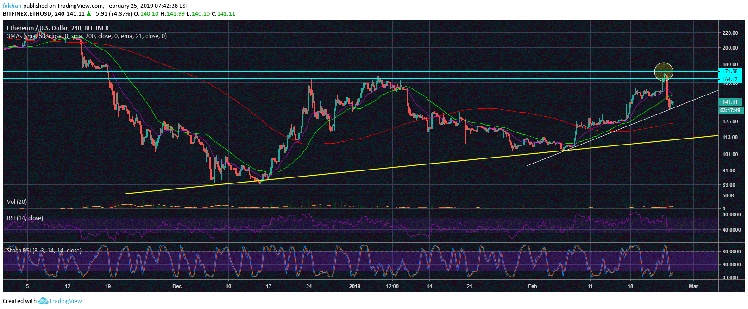
Ethereum (ETH) has declined significantly in the past 24 hours and the price is trading back around $141 down from $170. This might seem very alarming given the manner in which the price has declined but if we look at it from a neutral standpoint, this does not really change anything. The 4H chart for ETH/USD shows that the trend line is still intact and all the correction has done is drag the price back to the trend line support. The price is expected to rise from current levels back towards $170 in the days ahead and in this analysis we will discuss why we believe that to be the case. ETH/USD had two strong resistance levels, the first one around $164 and the second one around $171.
During the previous ETH/USD rally, the price climbed all the way past the $164 resistance but it did not test the $171 resistance. In other words, it left a gap in there which we expect will have to be tested in the days ahead. Given that the price has found a strong support above a critical trend line support, we expect it will be even easier for Ethereum (ETH) to rise back towards $170 from current levels. That being said, the sentiment now is completely in favor of the bears and we might expect a sharp pull back before ETH/USD even reaches towards that level. Another scenario could be a quick retest and rejection of the $171 level which might be too hard for retail traders to catch.
Ethereum (ETH) is currently trading below the 50 MA on the 4H timeframe after it broke below it. So, the price will have a hard time rising above it short term, but if it does, the odds of a rally towards $170 will improve significantly. As far as the ETH/USD chart is concerned, there still appears to be some hope and the price might have room for a short term rally slightly past the $171 mark before the final, more aggressive correction kicks in. We believe that all the recent crash has done is to postpone the inevitable decline to the downside. A weekly close with RSI conditions as they were before the crash would have hastened the decline, but now we might have to wait for a short term rally or a fake out to the upside first.
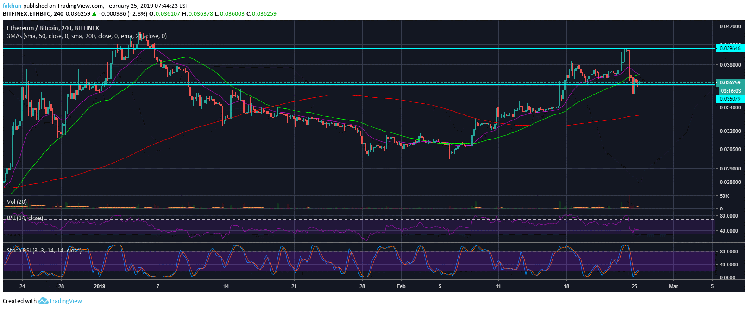
The 4H chart for ETH/BTC shows that Ethereum (ETH) is in a rock and a hard place kind of situation against Bitcoin (BTC). In other words, we might see a decline below the support that it is resting on at the moment but first we may see a rally to the upside. It is not hard to see which one is going to last longer, the rally to the upside or the decline. If the price falls below the 50 MA and triggers a death cross on the 4H timeframe, we might see the sell momentum increase even more. However, before that happens, we expect a short term rally to the upside which will likely trap some bulls, again.