Published
5 years ago on
January 03, 2019

Bitcoin (BTC) is looking for direction after going through an exhausting bear market for almost a year. It is unlikely that we are going to see the price take off to the moon straight from current levels. However, there are certain market indicators that give us clues as to the direction and pace of Bitcoin (BTC)’s next moves. One of those strong indicators is the Volatility Index (VIX). It is considered as a plausible indicator of the volatility in the stock market at a given time. Volatility is the degree of variation of the price of an asset. It is measured by the standard deviation of logarithmic returns. Simply put, the more volatile an asset, the riskier it is. This is because it has the potential to swing up and down by a greater degree.
If we look at the weekly chart for VIX, we can see that volatility in the stock market has been in a downtrend since the last financial crisis of 2007-2008. By then what the market feared had already happened and the volatility started to decline because traders had a clear idea regarding the direction of the market. The market recovered as most traders were on the same page. The volatility declined as the price rallied largely in one direction: up. Now, here is the interesting part. The Volatility Index (VIX) reached an all-time low in November, 2017 which is exactly the same time Bitcoin (BTC) was skyrocketing. Investors and traders had become far too comfortable with their positions. Most markets were thriving and most people believed that this rally could go on for a long time.
Shortly afterwards, the inevitable happened. When one side in the market gets far too comfortable, the markets makers think it is time to turn the tables. The Volatility Index (VIX) reached an all-time low in a few months after Donald Trump was elected president. The markets were doing well and the majority thought that having a businessman in the Oval Office is going to let that continue. However, the majority is often wrong and markets do not care about sentiments. Soon afterwards, the Volatility Index (VIX) started to rise as markets began to face problems from the outside. The Volatility Index (VIX) reached a yearly high in February 2018, the month the unfortunate incident of Florida shooting took place. It did decline afterwards but new issues like election manipulation, fears of impeachment and afterwards a trade war with China led to new waves of fears and unrest in the markets.
The Volatility Index (VIX) has now run into the 61.8% Fibonacci retracement level and it is unlikely to get past that. The more likely scenario is that the volatility will start to decrease as markets start to recover. The VIX is still in a downtrend since the last financial crisis and it is likely to remain in a downtrend till 2022. Last year was a strong indicator that this is not the tipping point even though the VIX made an all-time low. The markets still have plenty of room to rally before the next financial crisis. This also coincides with our projections for Bitcoin (BTC) in the years ahead.

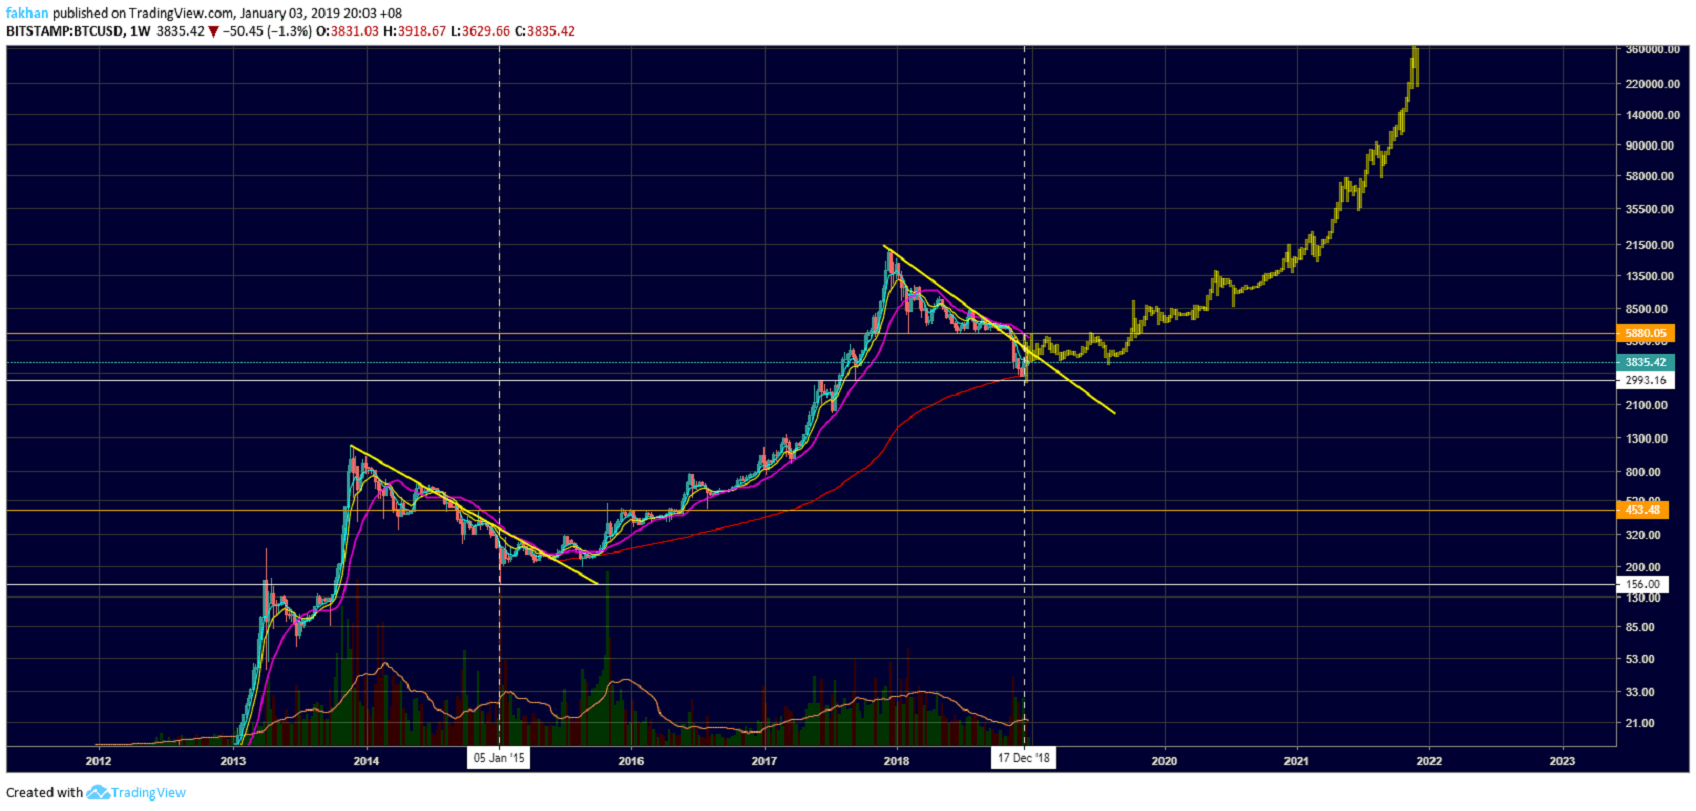
If the price of Bitcoin (BTC) were to trade in the same manner as it has for the last ten years, then we should see the price trading around $300,000 by the end of 2021. If we put the above weekly chart for BTC/USD next to the weekly chart for VIX, we can see that both support a rally all the way till 2022. This means that both Bitcoin (BTC) and the stock market are expected to rally till 2022 to reach new all-time highs. The BTC/USD weekly chart shows that the price has rallied after testing the 200 Week MA but nothing significant may be expected in 2019 as the shattered bullish resolve is going to take quite some time to recover. That being said, 2019 is the best year in the history of Bitcoin (BTC) to start accumulating before the next bull run.
Investment Disclaimer