Bitcoin (BTC)’s Next Move Hinges On EUR/USD Outlook for Next Week
Bitcoin (BTC) appears all set to rally with the beginning of a new year but there is one little catch. The price action of Bitcoin (BTC) is largely dependent on the future outlook of EUR/USD. During times of uncertainty, this is exactly what happens. Bitcoin (BTC) is still a highly speculative asset in an emerging market. Its movement during critical points is for the most part a reaction of the price of EUR/USD. We have observed this correlation many a time in the past and it is quite natural to expect. The price of Bitcoin (BTC) is paired to US Dollar (USD) on a lot of large exchanges which is why it makes sense to see Bitcoin (BTC) go up as the Dollar (USD) goes down.
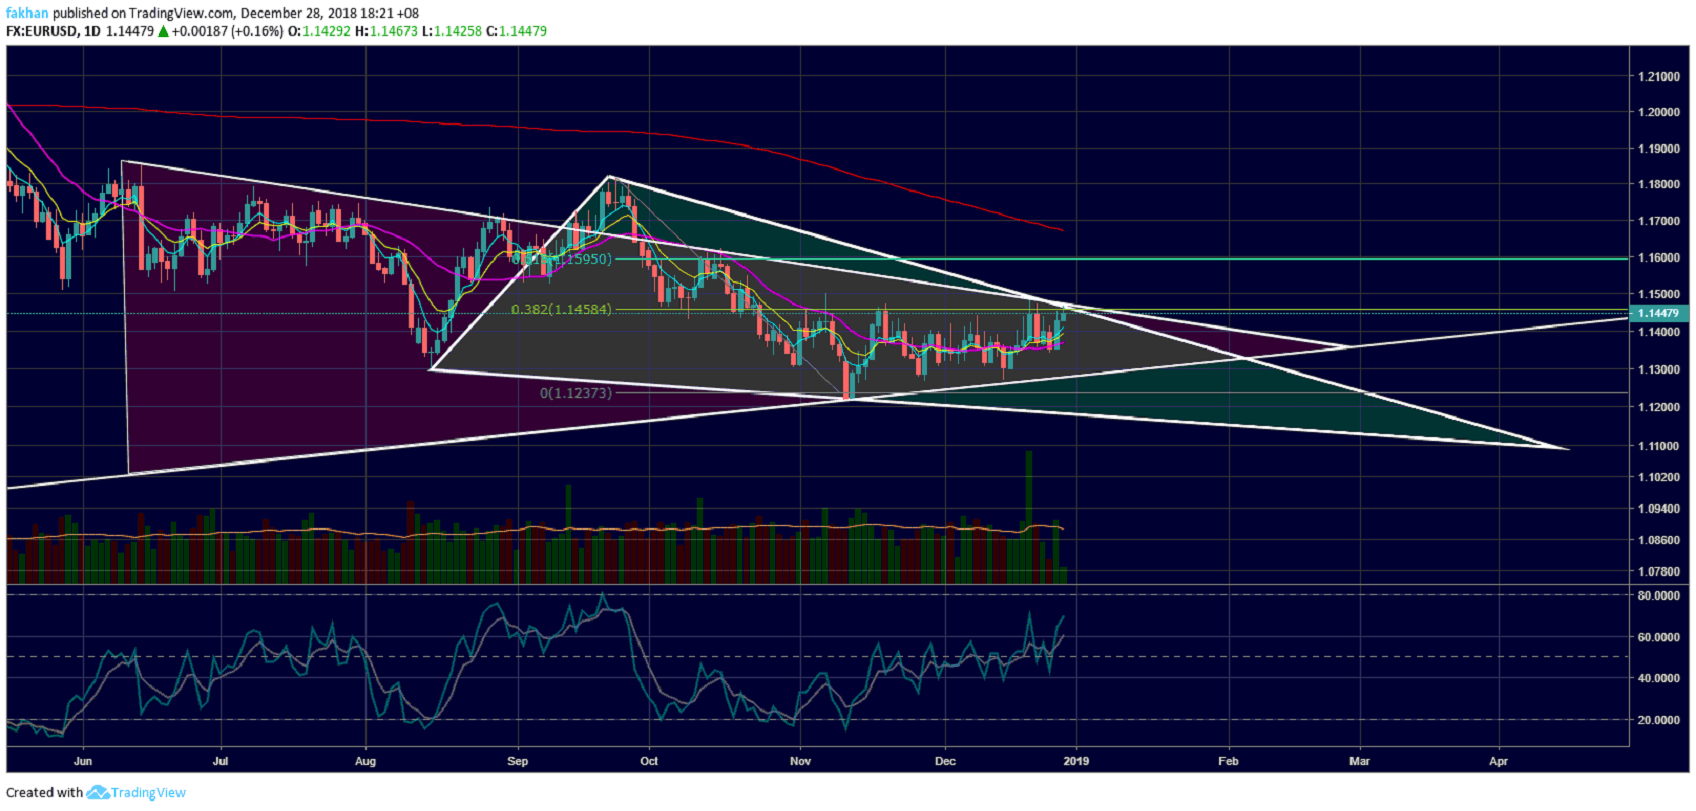
The outlook for EURO in the weeks ahead is not a very promising one. In fact, as the daily chart for EUR/USD shows, the price is currently trading in a triangle and a falling wedge at the same time. It has also touched the top of the triangle as well as the falling wedge at a point of their intersection that coincides with the 38.2% Fib level. This has further made it difficult for EUR/USD to break past this confluence of strong resistance levels. The more likely outcome at this point seems to be an imminent retracement back to the 21 Day EMA which will give the price some strength to stage a successful rally to break past this resistance. That being said, if EUR/USD does break and close below the 21 Day EMA, we can expect to see further downside. 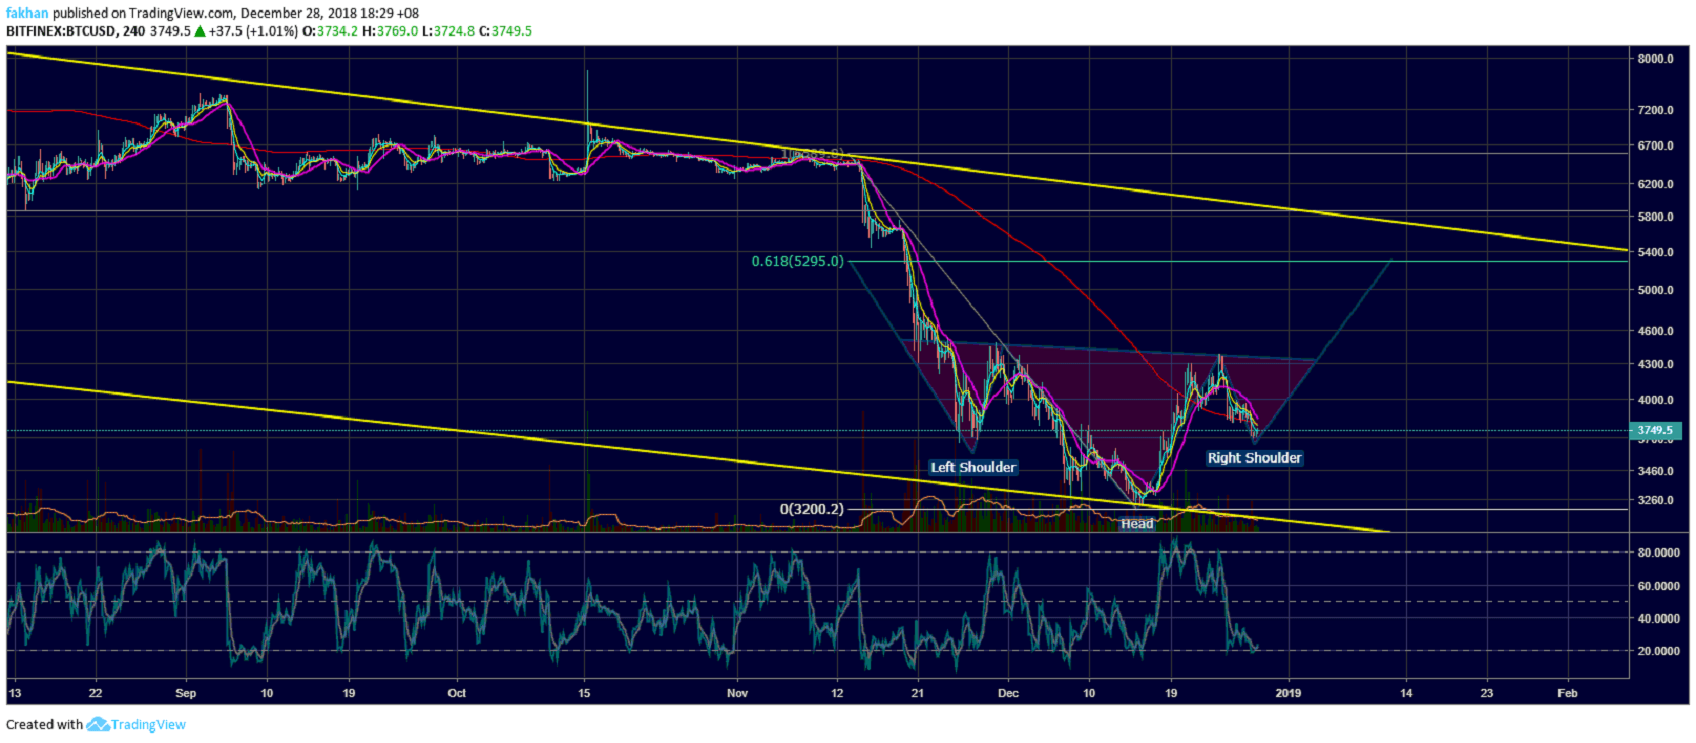
In case of a break below the triangle, we will see the price settle at the bottom of the falling wedge. Both EUR/USD and Bitcoin (BTC) are now nearing overbought territory on the daily time frame. This is an alarming sign which further diminishes the chances of a successful break out past the resistance. That being said, the RSI is a consequence of the price action and not the other way round. So, it would not be surprising to see both EUR/USD and Bitcoin (BTC) rally even under overbought conditions. It is important to note though that any such rally will be followed by a significant correction to the downside before the price can resume going up.

The weekly outlook for EUR/USD may not appear favorable but the 4H chart for BTC/USD tells a different story. We are now seeing an inverse head and shoulders formation in the making. We have seen such formation result in bullish breakout in BTC/USD many a time in the past. If this IH&S comes to fruition, we are likely to see the price of Bitcoin (BTC) rally to $5,200 to say the least. The price is currently oversold short term and definitely has room for a breakout in the days ahead. That being said, investors should not count on anything decisive before we have a clear direction for EUR/USD.