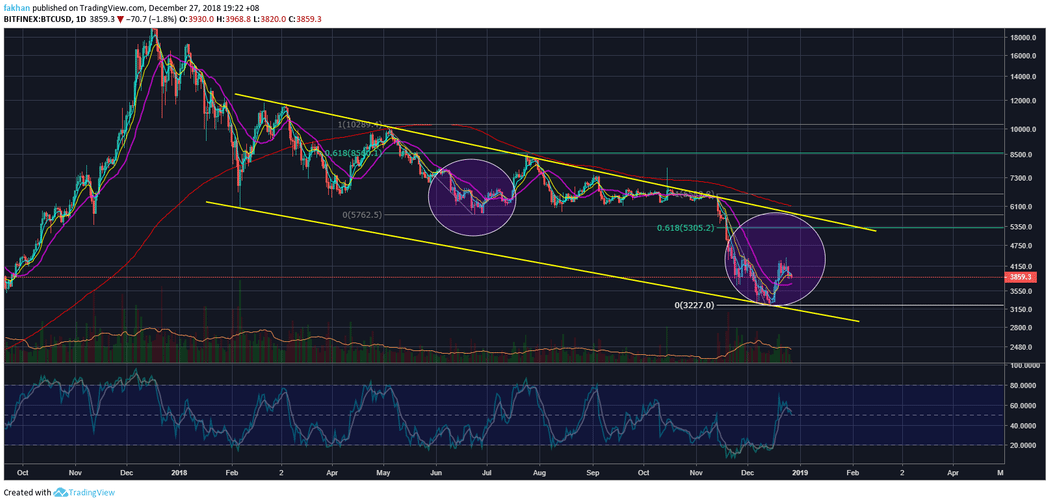
Bitcoin (BTC) is on track for a steady climb past $5,200 having already broken past the 21 Day EMA. The last time it did that, we saw BTC/USD testing the top of the descending channel. The fractal from June 2018 shows that Bitcoin (BTC) ended up shooting towards the top of the channel and tested the 61.8% Fibonacci retracement level before falling back into the channel. It is interesting to note here that during the previous rally, BTC/USD was not as overbought as it currently is. However, it still could not gather the strength to climb to the top of the descending channel without forming an inverse head and shoulders formation first.
This time, the RSI is terribly overbought and there would have been no way for the price to rally back to the top of the channel without completing an inverse head and shoulders first. As we can see, BTC/USD has already completed the left shoulder and the head and is just about to form the right shoulder. When the price begins to rally completing the right shoulder, it might be a bit too late to get in as all of this is going to happen very fast. Just as before, Bitcoin (BTC) is expected to be stopped at the 61.8% Fibonacci retracement level which coincides with the BTC/USD price level of $5,305. It is pertinent to note that this time the situation could be altogether different and Bitcoin (BTC) may break straight through the 61.8% Fibonacci retracement level after some initial struggle.
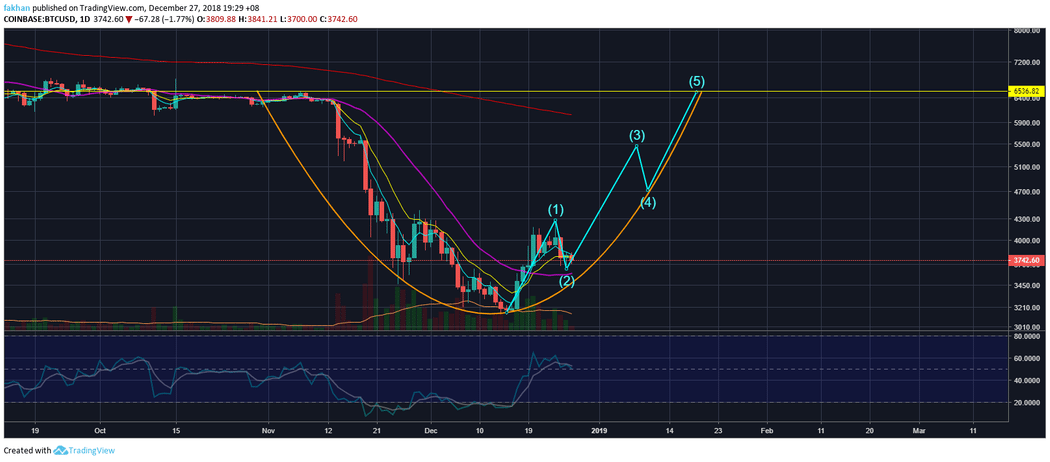
The reason Bitcoin (BTC) may actually end up piercing through the 61.8% Fib level this time is because a strong rally as this from the yearly low as going to be seen as a strong sign of a trend reversal. With that, we are going to see a lot of people waiting on the sidelines FOMO into the market and the price of BTC/USD may not act reasonably which is what often happens when the market is under the heavy influence of emotions. That being said, it is quite unlikely for Bitcoin (BTC) to reach anywhere close to $7,000 during the upcoming rally. The most likely scenario will be for the price to break slightly past $6,000 and then start falling back into the descending channel. The Elliot impulse wave profile on the BTC/USD daily chart also points to a rally slightly above $6,000. This would also result in an effective retest of the previous market structure that we have been calling for during our previous analyses.

Elliot wave analysis of the above chart shows that we are currently in the third i.e. the longest wave of the bullish impulse which is going to take the price all the way towards $5,200. After that, we will see a minor retracement but a strong break above the 61.8% Fib level will turn the balance back in favor of the bulls in no time and give them the false impression that Bitcoin (BTC) is going to climb back towards its previous ATH in the next few months. Meanwhile, the bears would get impatient by the day seeing BTC/USD rally under overbought conditions. Most trigger happy retail bears will give in to that feeling of impatience and that is exactly when the whales would stage that massive short squeeze that we have been talking about for the last few weeks.