Published
3 years ago on
May 29, 2020
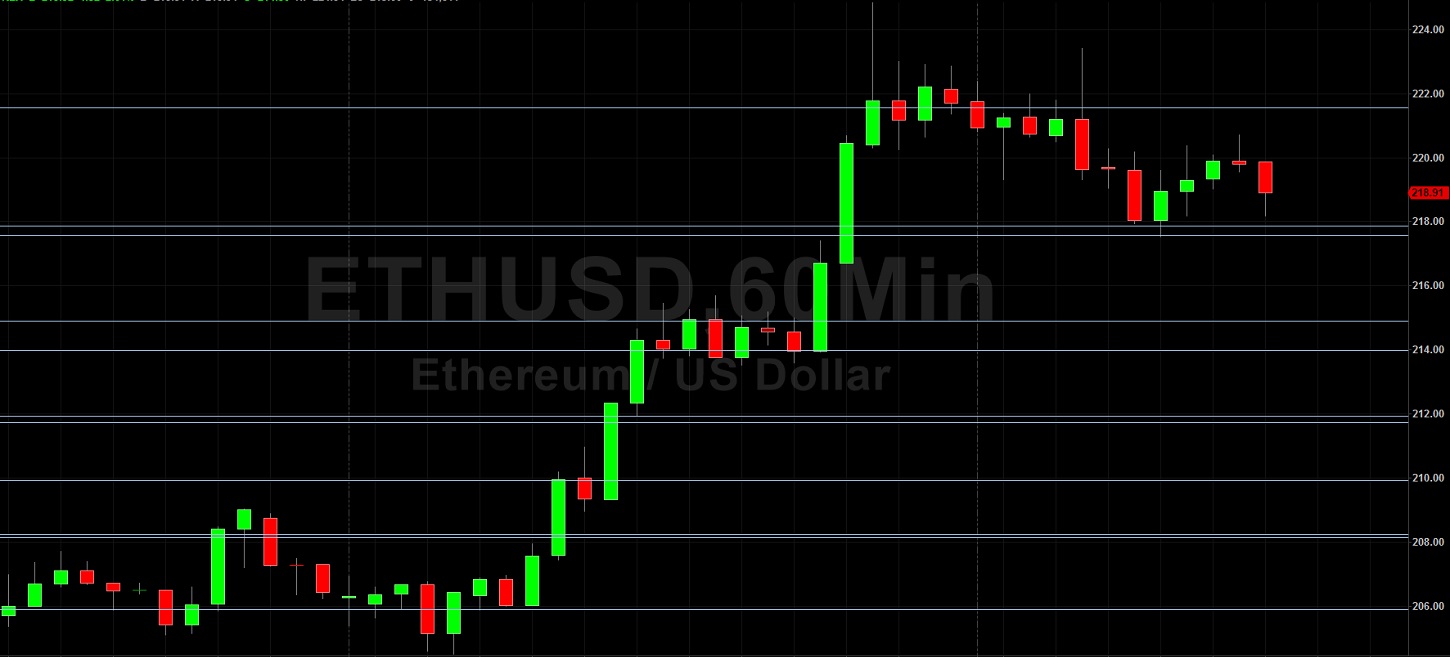
Ethereum (ETH/USD) gave back some earlier gains during today’s North American session as the pair receded to the 218.19 level after buying pressure lifted the pair from the 217.52 area to the 220.71 area. Traders took the pair higher to the 224.84 area during today’s Asian session, its strongest print since late April, after Stops were elected above the 213.66 area, a level that represents an upside price target related to buying pressure that originated around the 90.00 area in March. Stops were also triggered above the 216.57 area, a level that represents the 78.6% retracement of the recent depreciation from 227.50 to 176.43. Earlier this week, Stops were elected above the 207.42 area, representing the 23.6% retracement of the appreciation from 176.43 to 216.99. The 201.50 and 196.71 areas represent the 38.2% and 50% retracements of this range, and ETH/USD bulls observed the market deriving some technical support from these levels. Additional appreciating ranges that are technically significant include the move from 148.08 to 227.50, the move from 123.72 to 227.50, and the appreciation from 90.00 to 227.50.
Important technical levels related to those ranges include the 208.76, 203.01, 197.16, 195.10, 187.79, and 175.02 levels, and traders are very interested to observe how price activity reacts around these levels. Below current market activity, traders continue to monitor the 196.56 and 177.39 levels as downside price targets, both of which relate to selling pressure that emerged around the 253.01 area in early March. Additional downside areas of potential technical support include the 190.93, 186.00, 185.39, and 185.11 areas. Chartists are observing that the 50-bar MA (4-hourly) is bullishly indicating above the 100-bar MA (4-hourly) and above the 200-bar MA (4-hourly). Also, the 50-bar MA (hourly) is bullishly indicating above the 100-bar MA (hourly) and above the 200-bar MA (hourly).
Price activity is nearest the 50-bar MA (4-hourly) at 206.35 and the 50-bar MA (Hourly) at 212.81.
Technical Support is expected around 191.27/ 185.39/ 177.39 with Stops expected below.
Technical Resistance is expected around 227.50/ 232.88/ 242.09 with Stops expected above.
On 4-Hourly chart, SlowK is Bearishly below SlowD while MACD is Bullishly above MACDAverage.
On 60-minute chart, SlowK is Bearishly below SlowD while MACD is Bearishly below MACDAverage.
Investment Disclaimer