Published
1 year ago on
June 20, 2022
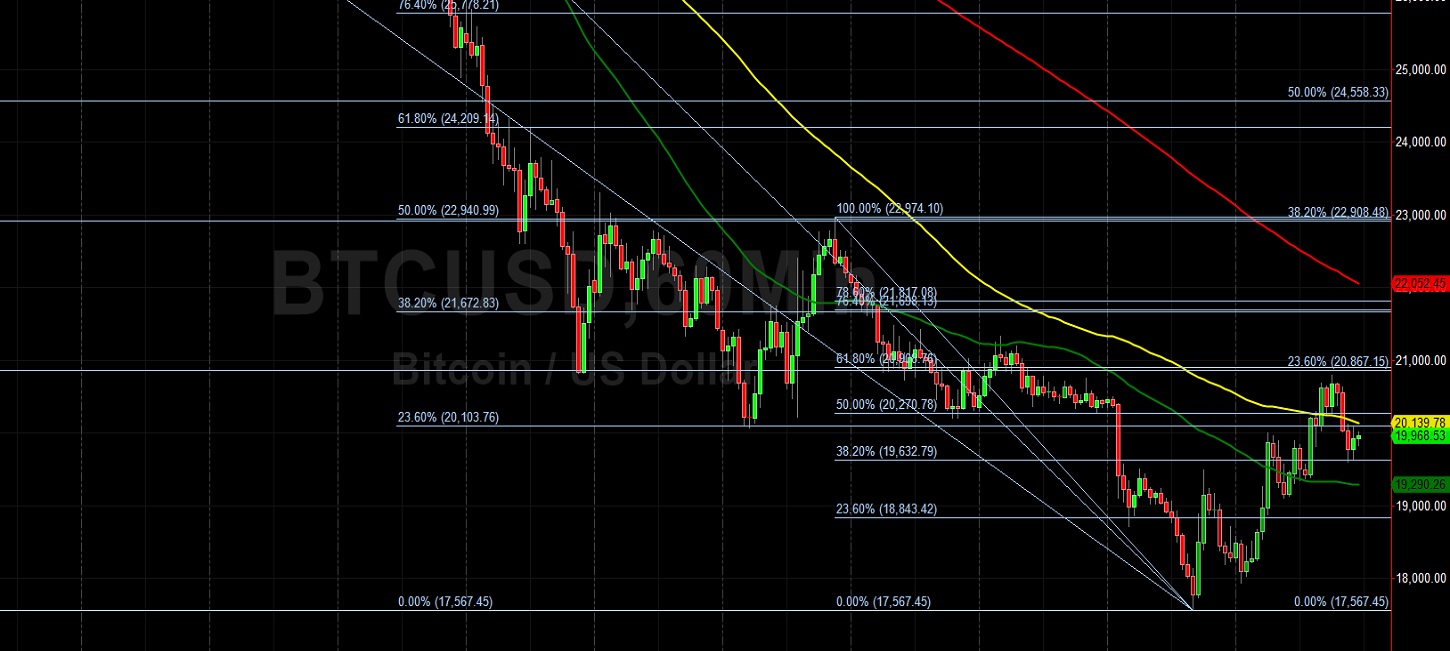
Bitcoin (BTC/USD) struggled to sustain a small improvement early in the Asian session as the pair tried to get back above the psychologically-important 20000 figure after peaking around the 20795.11 area during a short-lived recovery higher. The short-lived rally fizzled out below the 20867.15 area, representing the 23.6% retracement of the depreciating range from 31549.21 to 17567.45. Traders recently lifted BTC/USD from the 17567.45 area, its weakest showing since November 2020. Stops were elected below the 17787.51 level during the ongoing selling pressure, a very important technical area that represents the 50% retracement of the appreciating historical range from 3858 to 31717.02. Stops were recently elected below the 20195.33 area during the depreciation, a downside price objective related to selling pressure that intensified around the 52100 area. If BTC/USD extends its ongoing pullback, additional downside price objectives include the 16990, 15502, and 14500 areas.
BTC/USD has now depreciated more than 35% from the beginning of the month through its month-to-date technical trough, and the pair has now slumped more than 57% year-to-date and more than 68% from its all-time high. Technical resistance levels and areas of potential selling pressure include the 20867, 22908, 24558, 26208, 28249, and 28557 areas. Stronger technical resistance is evident around the 27288 area, with Stops likely in place above this area. Traders are observing that the 50-bar MA (4-hourly) is bearishly indicating below the 100-bar MA (4-hourly) and below the 200-bar MA (4-hourly). Also, the 50-bar MA (hourly) is bearishly indicating below the 100-bar MA (hourly) and below the 200-bar MA (hourly).
Price activity is nearest the 50-bar MA (4-hourly) at 22020.12 and the 100-bar MA (Hourly) at 20165.97.
Technical Support is expected around 16990.14/ 14500.15/ 10432.73 with Stops expected below.
Technical Resistance is expected around 24365.11/ 27455.20/ 32383.96 with Stops expected above.
On 4-Hourly chart, SlowK is Bullishly above SlowD while MACD is Bullishly above MACDAverage.
On 60-minute chart, SlowK is Bearishly below SlowD while MACD is Bullishly above MACDAverage.
Disclaimer: This trading analysis is provided by a third party, and for informational purposes only. It does not reflect the views of Crypto Daily, nor is it intended to be used as legal, tax, investment, or financial advice.
Investment DisclaimerStacks (STX) and Microstrategy (MSTR) are excellent bitcoin (BTC) leverage plays
Bitcoin bearish sentiment rules the market - buy more?