Published
3 years ago on
February 18, 2021
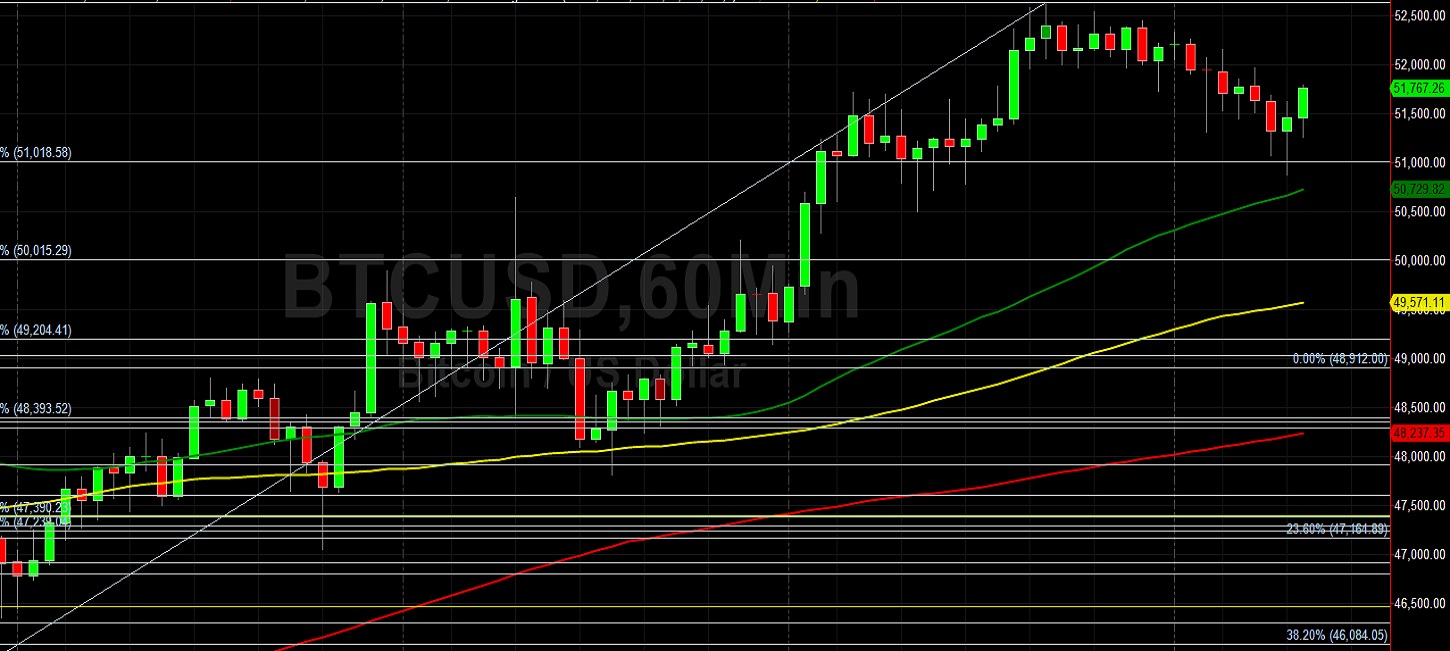
Bitcoin (BTC/USD) gave back some gains early in today’s North American session as the pair depreciated to the 50875 area after trading as high as the 52640.35 area during the Asian session, a new lifetime high. Some smaller Stops were elected below the 51018.58 area during today’s pullback, a retracement level that represents the 23.6% retracement of the recent appreciating range from 45768.46 to 52640.35. BTC/USD easily ran through some upside price objectives over the past couple of days including the 50394.69, 51312.54, 51594.32, 51732.54, 52052.19, 52310.93, and 52505.24 levels. These upside price objectives are technically significant on account of buying pressure that originated around the 27678, 17580, 9819.83, 17580, 16200, 17596.74, and 21913.84 levels. If BTC/USD continues its upward strength, traders will focus on upside price objectives including the 52777.60, 53194.95, 53276.47, 53357.59, and 54400 levels.
Following the recent surge of BTC/USD, traders are carefully watching potential areas of technical support including the 51018.58, 50015.29, 49204.41, 48393.52, 47390.23, and 47239.04 levels. Additional areas of potential upside pressure include 49036.87, 46807.59, 45005.85, 43204.11, 40974.83, and 40638.92. Traders are observing that the 50-bar MA (4-hourly) is bullishly indicating above the 100-bar MA (4-hourly) and above the 200-bar MA (4-hourly). Also, the 50-bar MA (hourly) is bullishly indicating above the 100-bar MA (hourly) and above the 200-bar MA (hourly).
Price activity is nearest the 50-bar MA (4-hourly) at 48333.93 and the 50-bar MA (Hourly) at 50728.58.
Technical Support is expected around 47111.66/ 46393.28/ 45773.41 with Stops expected below.
Technical Resistance is expected around 52777.60/ 53194.95/ 53276.47 with Stops expected above.
On 4-Hourly chart, SlowK is Bearishly below SlowD while MACD is Bullishly above MACDAverage.
On 60-minute chart, SlowK is Bullishly above SlowD while MACD is Bearishly below MACDAverage.
Disclaimer: This trading analysis is provided by a third party, and for informational purposes only. It does not reflect the views of Crypto Daily, nor is it intended to be used as legal, tax, investment, or financial advice.
Investment DisclaimerFoundation: A New Trading Paradigm
Bitrue to List Hummingbot Governance Token (HBOT)