Published
3 years ago on
February 15, 2021
Bitcoin
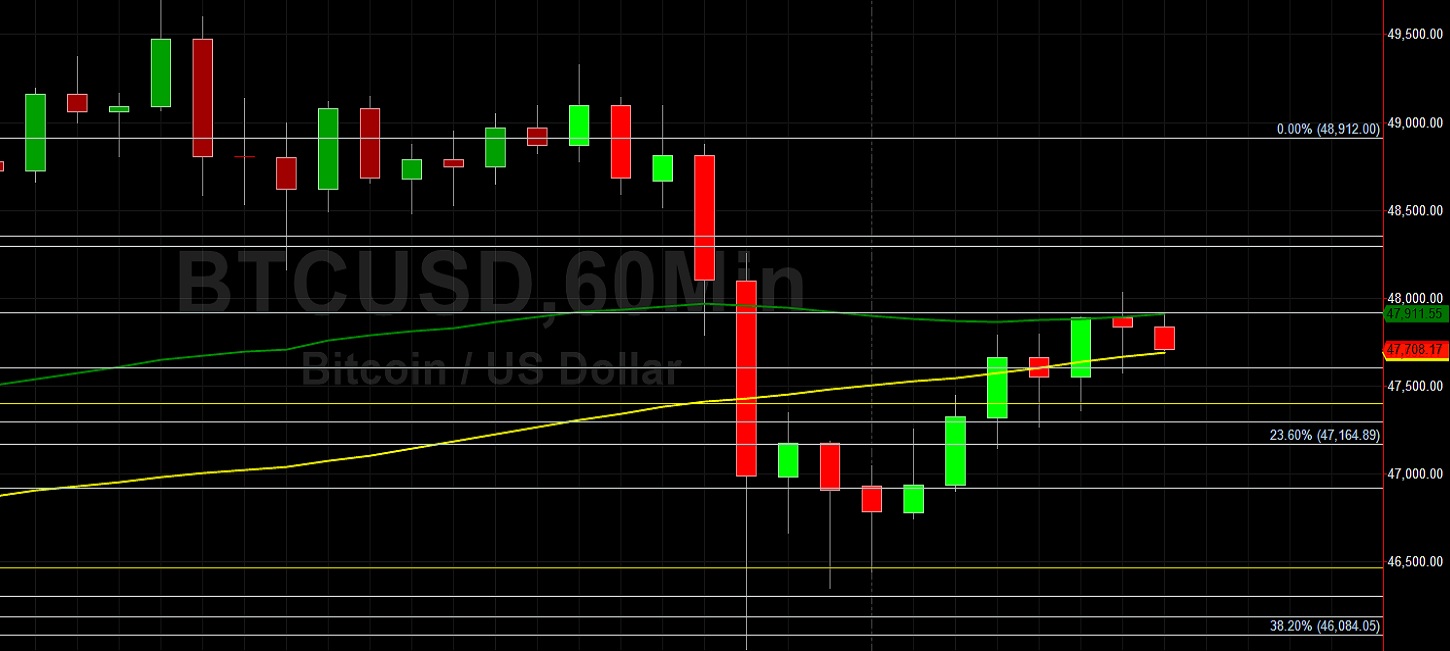
Bitcoin (BTC/USD) reclaimed some losses early in today’s North American session as the pair appreciated to the 48030.94 area after trading as low as the 45768.46 area during the Asian session, with the intraday low representing a test of the 23.6% retracement of the recent appreciating range from 32200 to 49700. Chartists observe BTC/USD established a fresh lifetime high during the weekend, stopping short of an assault on the psychologically-important 50000 figure. Traders remain focused on the psychologically-important 50000 figure following last week’s acute upward move that saw Stops elected above the 44961.99, 45285.67, 46057.20, 46338.25, 46884.52, 47100, 47738.63, and 47966.77 levels. If BTC/USD continues its upward strength, traders will focus on upside price objectives including the 49818.47, 49994.09, 50270.14, 59394.69, 51312.54, 51594.32, 51732.54, and 52052.19 levels.
Following the recent surge of BTC/USD, traders are carefully watching potential areas of technical support including the 43705.62, 40925.19, 38678, 36430.81, 33650.38, and 33231.42 levels. Traders also note that Stops were recently elected above the 35943.73, 36480.83, and 36854.45 areas as well, upside price objectives related to previous buying pressure around the 17580, 16200, and 9819.83 levels and the sell-off intensified below these areas during the recent depreciation. Traders are observing that the 50-bar MA (4-hourly) is bullishly indicating above the 100-bar MA (4-hourly) and above the 200-bar MA (4-hourly). Also, the 50-bar MA (hourly) is bullishly indicating above the 100-bar MA (hourly) and above the 200-bar MA (hourly).
Price activity is nearest the 50-bar MA (4-hourly) at 45695.69 and the 50-bar MA (Hourly) at 47914.13.
Technical Support is expected around 43705.62/ 40925.19/ 38678 with Stops expected below.
Technical Resistance is expected around 49818.47/ 49994.09/ 50270.14 with Stops expected above.
On 4-Hourly chart, SlowK is Bearishly below SlowD while MACD is Bearishly below MACDAverage.
On 60-minute chart, SlowK is Bullishly above SlowD while MACD is Bearishly below MACDAverage.
Disclaimer: This trading analysis is provided by a third party, and for informational purposes only. It does not reflect the views of Crypto Daily, nor is it intended to be used as legal, tax, investment, or financial advice.
Investment DisclaimerDexalot Brings Its CEX-Like DEX Trading Platform To Ethereum L2 Arbitrum
Foundation: A New Trading Paradigm